Is The Uptrend Over For The USD/CHF Pair?
- 27 Nov 2018
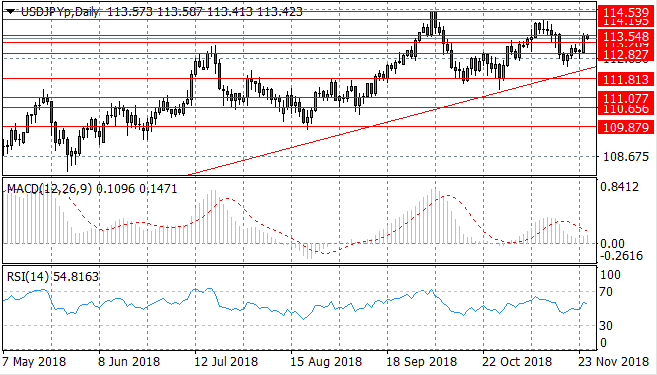
USD/JPY
The USD/JPY pair has begun a bullish revival once again and is now testing the 113.54 price level. Momentum indicators are moderately bullish; with MACD extending a bullish position above the zero line and RSI has broken the default line to the upside.
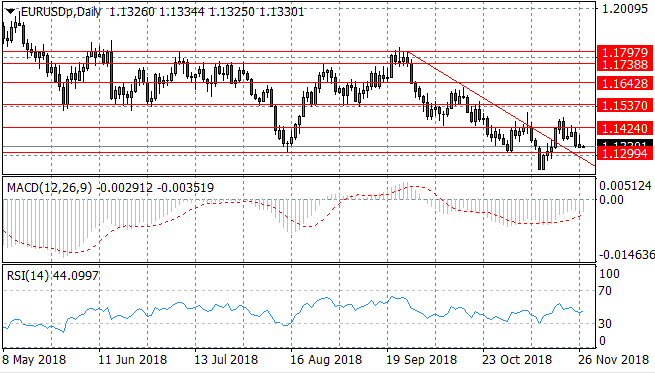
EUR/USD
The EUR/USD pair suffered another mild sell-off in recent trading which has resulted in the pair falling back below the 1.142 price level. The next price target is the 1.129 support line. MACD has extended its position in bearish territory and RSI has crossed the default line to the downside.
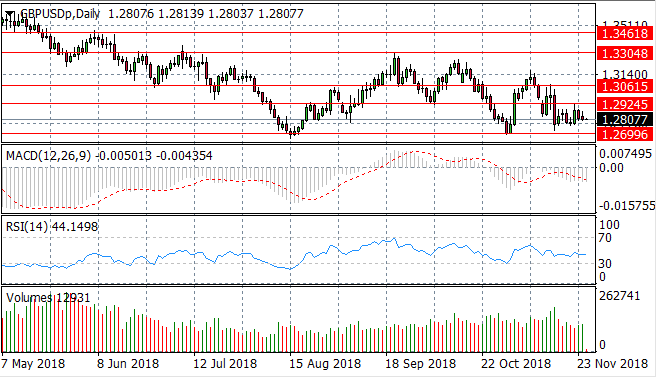
GBP/USD
Fundamental factors influenced the recent sell-off in the GBP/USD pair and these factors continue to put pressure on the Pound. The pair is consolidating mid trading range where the 1.269 price level remains the floor. Momentum indicators remain bearish with MACD extending beyond the zero line and RSI continuing the descending trajectory.
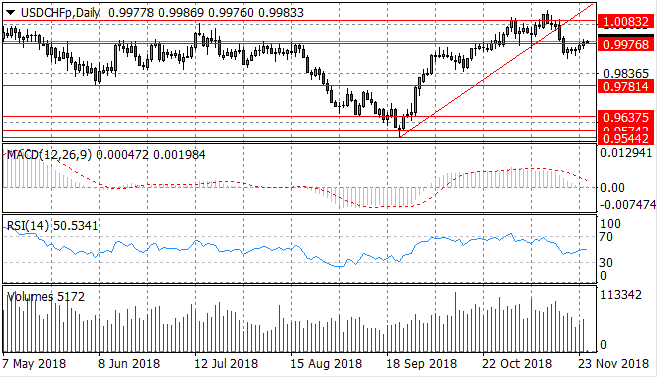
USD/CHF
The USD/CHF pair has returned to test the 0.997 price level. The next target price for buyers is the 1.008 price level, however, given that price action has broken the descending trendline to the downside, momentum appears to be with sellers. Momentum indicators are mixed with MACD approaching the zero line and RSI approaching the default line with bullish momentum.
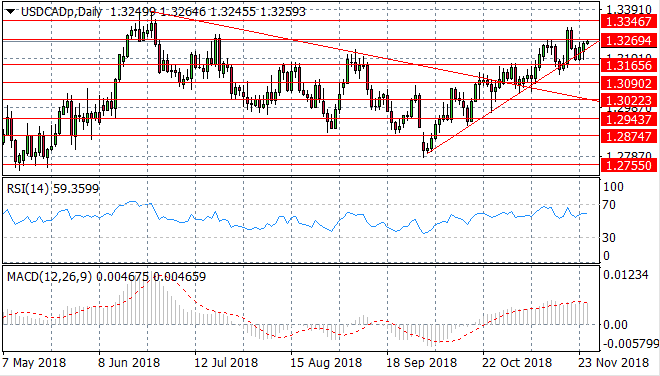
USD/CAD
The USD/CAD pair has reached the apex of an ascending triangle and a bullish breakout is indicated with this chart pattern. Price action is testing the 1.326 price level as the pair rallies once again. RSI has pulled back from overbought conditions and MACD remains in strongly bullish territory.
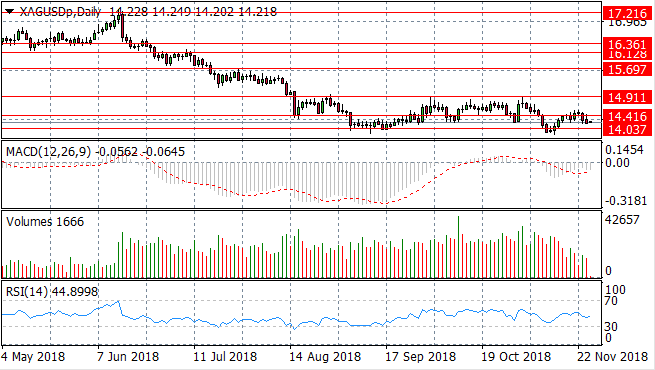
SILVER
Silver has rebounded from the 14.03 price level to maintain a recent trading range between the 14.03 and 14.91 price levels. The metal continues to bounce around the 14.41 price level. A series of small-bodied candles indicate neither buyers or sellers are dominating the commodity therefore it will likely consolidate within range.
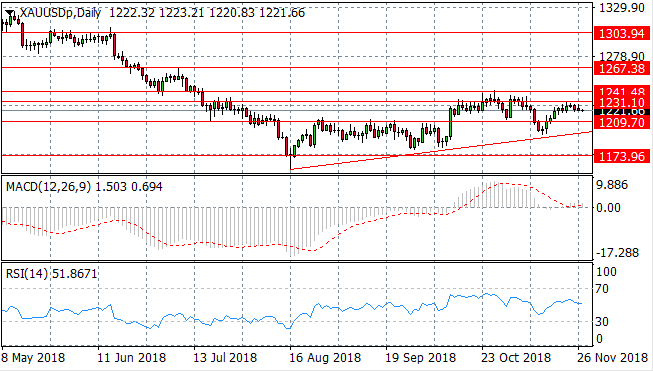
GOLD
Gold has once again undergone a bullish retracement from the ascending trendline and is testing the 1231.10 price level. Momentum indicators appear to be flat-lining with no bias in either direction. Given the struggle the metal has had to break this resistance level, price action will be more likely to head back towards the 1209.70 support line.
OIL
Oil appears to have entered into a descending flag pattern, with price action making small retracements followed by strong sell-offs. MACD continues to extend into bearish territory and RSI continues to bounce along just beneath the 30 support level. Volume has spiked once again as sellers dominate the commodity.

Sign up to get started
LIQUIDITY
PROVIDERS