Oil Market Volatility Dominates Price Action
- 23 Jan 2020
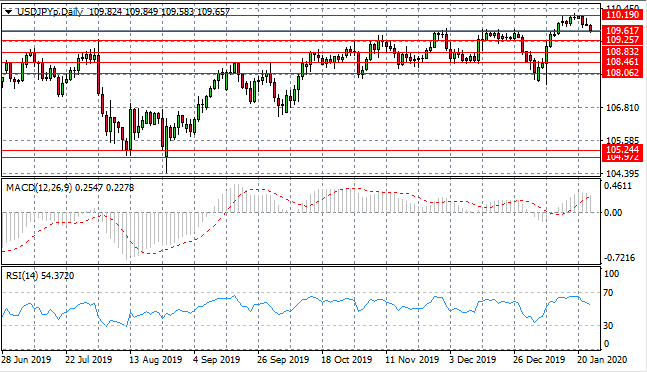
USD/JPY
The USD/JPY pair has begun to pull away from the 110.19 resistance line, as sellers being to dominate price action. Currently the pair is testing the 109.61 price level; which represents a strong resistance level in previous trading. A break would therefore be significant. Momentum indicators are bearish with RSI pulling away from overbought conditions.
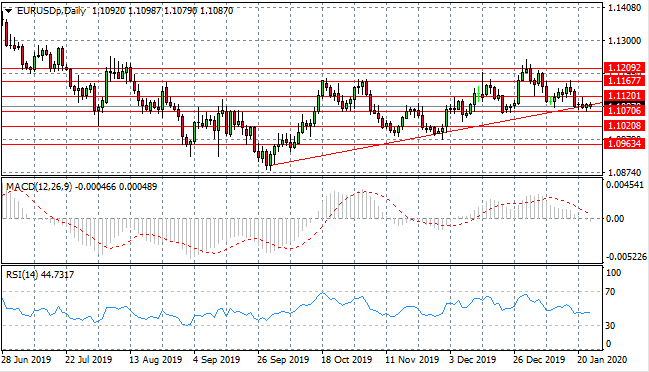
EUR/USD
The Eurodollar has once again pulled back to the ascending trendline with a strong bearish move in recent trading. The pair has been unable to break the ascending trendline and the support area, indicating another bullish rebound is likely. Momentum indicators are neutral if slightly bearish.
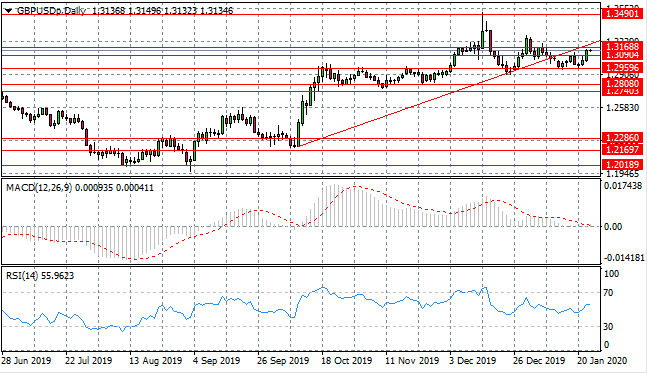
GBP/USD
The GBP/USD pair found support with buyers taking price action towards the 1.316 resistance level and back towards the ascending trendline. On previous occasions, this resistance level has represented a ceiling. Volatility can be expected as Brexit is finalized. Momentum indicators are moderately bullish.
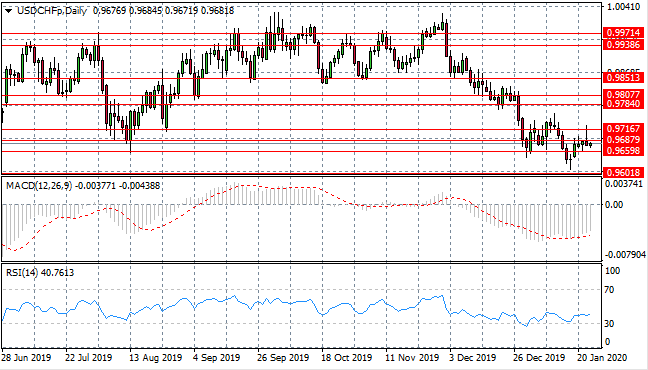
USD/CHF
The USD/CHF reversal has stalled as selling pressure rose in yesterday’s trading. Price action spiked through the 0.971 resistance area and pulled back to test the 0.968 resistance level once again. Momentum indicators have bullish trajectories.
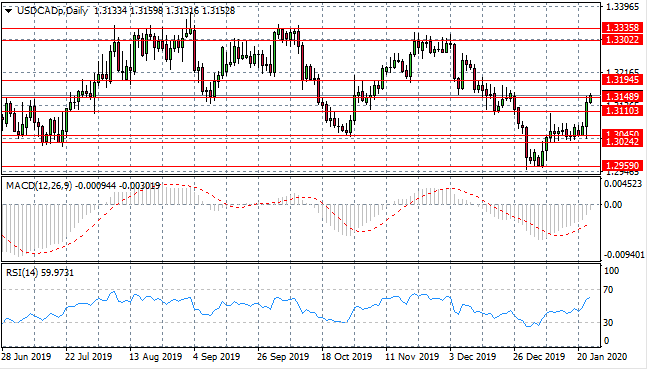
USD/CAD
USD/CAD buyers have returned to take price action through the 1.311 resistance level and to test the 1.314 resistance area. This resistance area has represented a key support level in the past. A trading range exists between the 1.314- 1.330 price levels and price action may return to this range. Momentum indicators have upward trajectories with RSI moving into the buy channel.
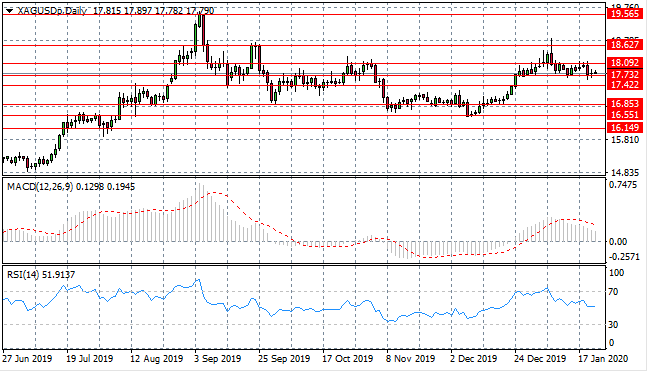
SILVER
Silver has begun a descent to resume a previous downtrend and as such, is testing the 17.73 support level. A break of this support level and a move towards the 17.42 support level would indicate the return to a previous trading range. Momentum indicators also have bearish trajectories.
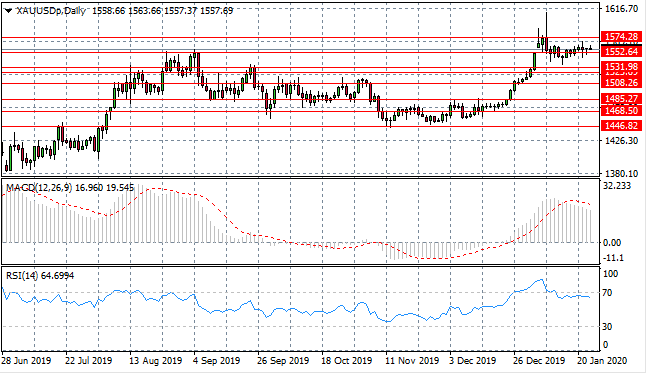
GOLD
Gold fails to clear the 1552 price area as buyers appear to lack incentive to drive price action higher. A series of doji candles represent indecision and may be a build up to a breakout. Momentum indicators are pulling back from strongly overbought conditions.
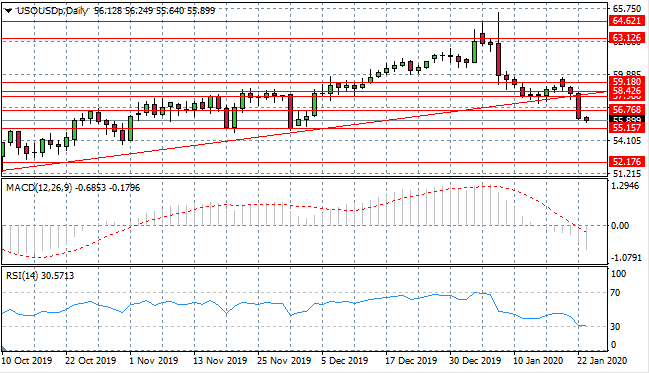
OIL
WTI sellers have returned with conviction to push price action through the ascending trendline and several support areas including the 56.76 price level. The next target is the $55 per barrel range. Given that a bullish rebound normally takes place at this ascending trendline, a break suggests a longer-term trend change. Momentum indicators are bearish; with RSI testing oversold conditions.
Sign up to get started
LIQUIDITY
PROVIDERS