Can The WTI Recovery Last?
- 19 May 2020
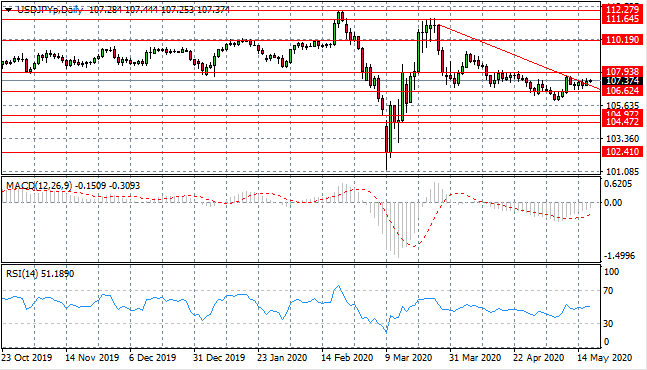
USD/JPY
The USD/JPY pair has rebounded from the 106.62 price level and has broken the descending trendline. The next target is the 107.93 resistance level. A longer-term downtrend is underway therefore rallies may not last. Momentum indicators have moderate upward trajectories.
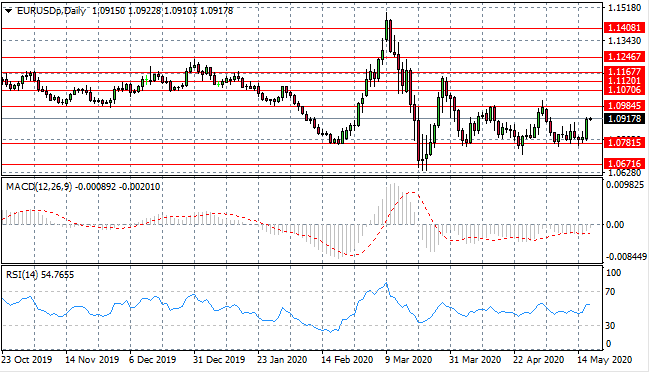
EUR/USD
The Eurodollar has rebounded from the 1.078 support line and is heading back towards the 1.098 resistance area. Price action will likely remain in range between these two price levels. Momentum indicators remain in neutral territory.
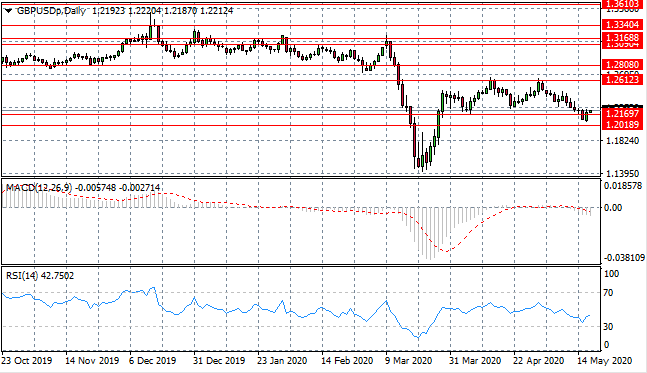
GBP/USD
The GBP/USD pair has stalled and begun to climb back above the 1.216 price level after an extended bearish bias. Going forward, the pair will likely continue to oscillate between the 1.216 and 1.261 price levels. Momentum indicators are undergoing reversals.
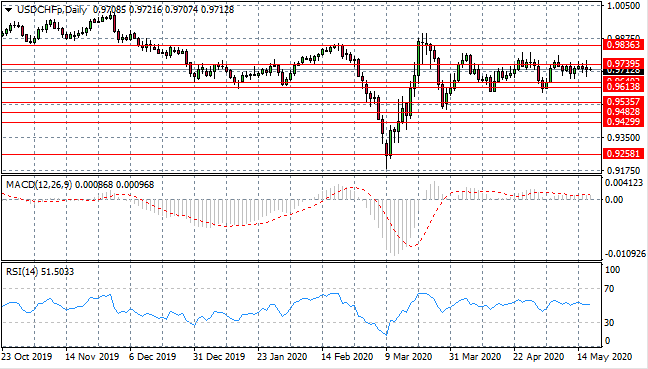
USD/CHF
The USD/CHF pair has failed several times at the 0.973 price level. Each pullback results in another test of the resistance area and it seems likely that the pair will continue to move within the 0.961- 0.973 trading range. Momentum indicators are languishing in neutral territory.
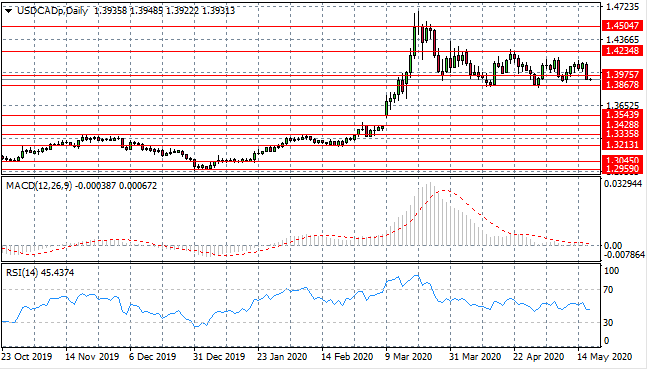
USD/CAD
The USD/CAD pair has failed once again to clear the 1.397 price line to the upside. Sellers have returned to drive price action back towards the 1.386 support level, where bullish rebounds generally take place. Momentum indicators support the bearish bias with downwards trajectories.
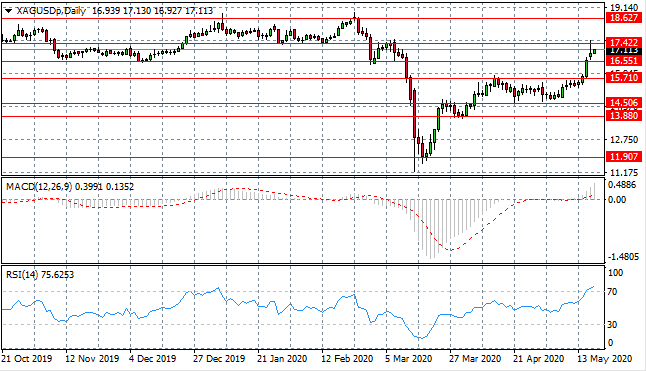
SILVER
A Silver rally has taken the metal back towards the 17.42 resistance area which represents a previous trading range. Given the uncertain fundamentals, the rally may not be sustained. There are some signs that buyers may be losing steam as selling pressure rises. RSI indicates that the metal is overbought.
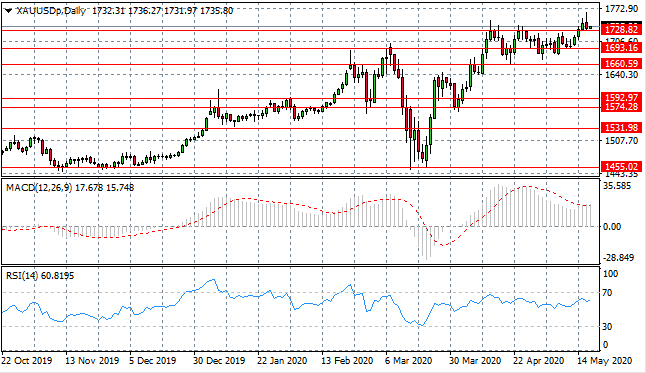
GOLD
Gold has broken the upper trading range at the 1728 resistance level, yet the breaking has been met with a rise in selling pressure. Today’s trading will likely determine whether the rally will continue or a reversal will take place. Momentum indicators support the bullish bias with upward trajectories, though RSI is approaching overbought conditions.
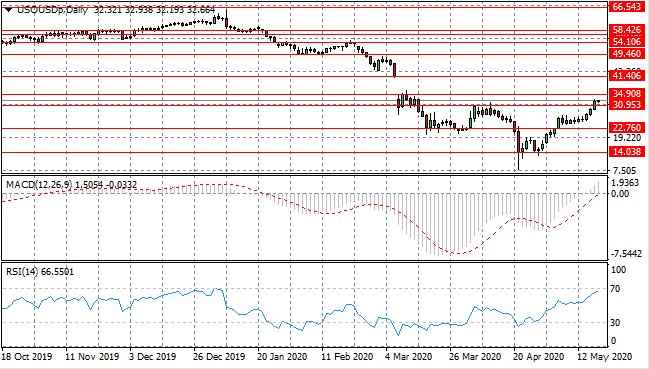
OIL
WTI buyers have been able to build momentum to drive price action towards the 34.90 resistance level. A break of this resistance level would be significant as it represents the gap fill line. Momentum indicators have sharp upward trajectories, yet RSI is approaching overbought conditions.
Sign up to get started
LIQUIDITY
PROVIDERS