US Dollar Begins To Falter
- 26 Apr 2019
Be The 1st To Redeem $50 Cash Rebates! Limited-time offer! Get it now!
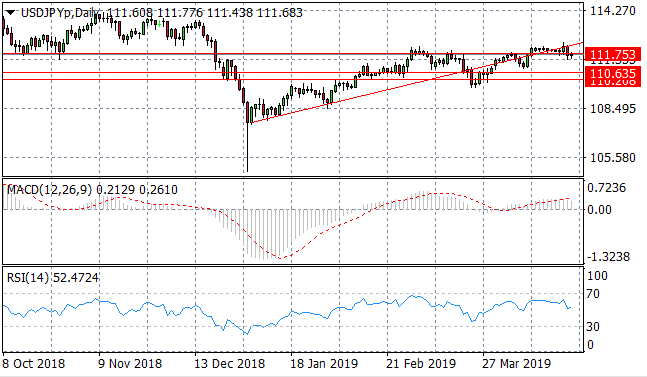
USD/JPY
The USD/JPY pair has fallen back below the ascending trendline and is once again testing the 111.75 price level which has developed as a strong support area for the pair. Momentum indicators are beginning a bearish reversal.
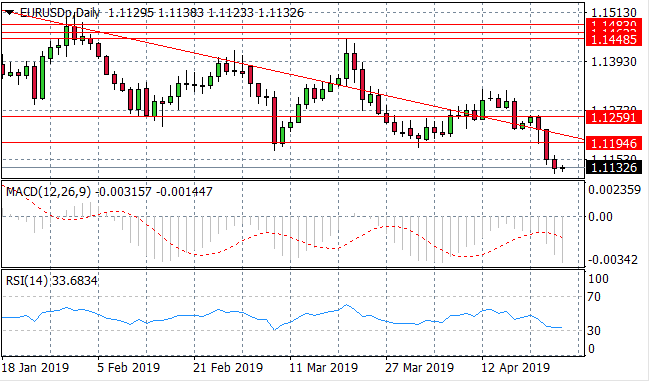
EUR/USD
The EUR/USD pair is experiencing significant volatility as a result of macroeconomic factors. The descending trendline has become an obvious target for buyers yet the pair has broken the trendline in emphatic fashion. Additionally, a break of the 1.119 price level suggest significant bearish sentiment. Momentum indicators are neutral/bearish.
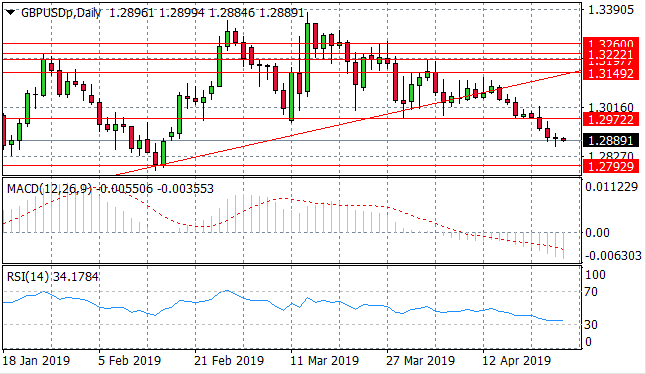
GBP/USD
The GBP/USD pair has broken the ascending trendline to the downside, as well as the 1.297 price level with the next target at the 1.279 price level. Momentum indicators have moved further into bearish territory, with RSI approaching oversold conditions.

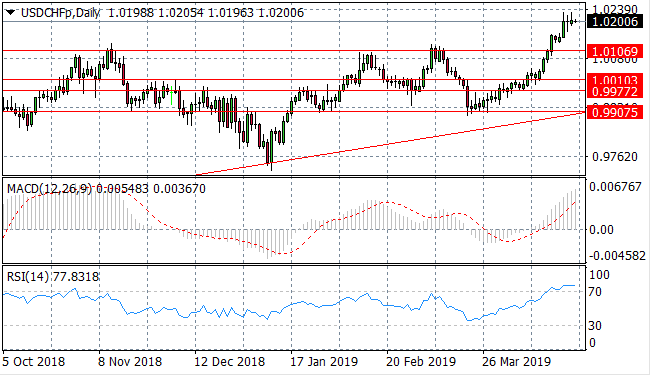
USD/CHF
The USD/CHF pair has undergone a strong rally however, there are signs that the rally is losing steam. A doji candle at the top of the uptrend may be the first sign that a reversal is imminent. Momentum indicators are mixed, with MACD extending its bullish position and RSI stalling in overbought conditions.
USD/CAD
The USD/CAD pair has broken the upper trendline in a much anticipated bullish breakout to complete the symmetrical triangle pattern. The obvious target for buyers is the recent price high at the 1.363 area, however doji candles indicate that buyers have lost steam. Momentum indicators have turned bullish in support of the rally.

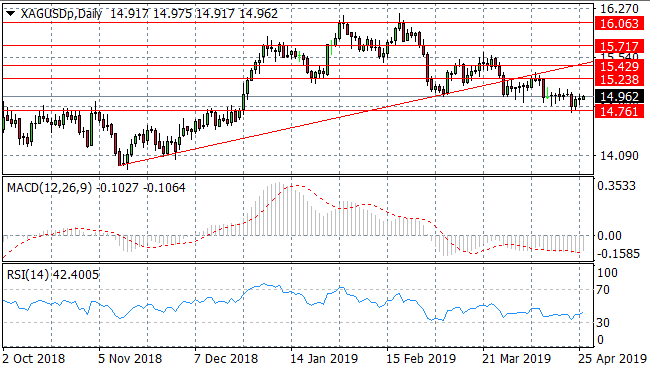
SILVER
Silver has broken the 15.23 support line and the metal has assumed a new trading range after a recent sell-off. Price action has bounced off of the 14.76 price level and appears to forming bullish momentum. Momentum indicators are beginning bullish reversals.
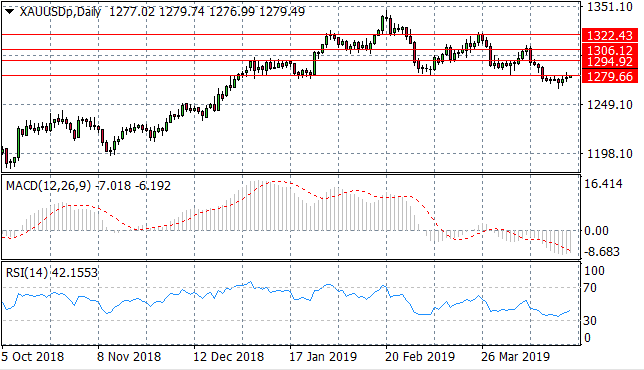
GOLD
Gold has broken the 1279.66 support level representing the end of the recent rally. The metal has broken out of a trading range between the 1279.66 and 1322.43 price levels which may signify longer-term bearish sentiment. Momentum indicators are reversing as price action tests the 1279.66 price level once again.
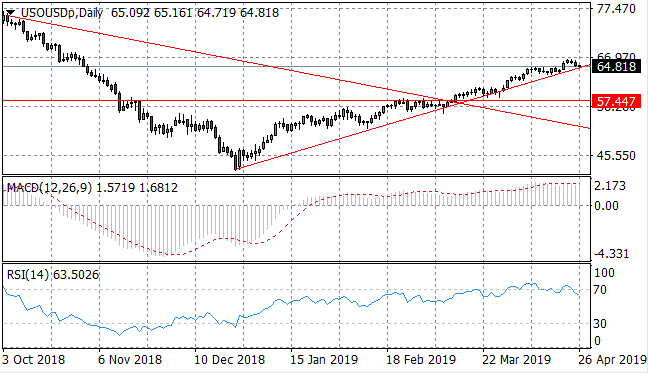
OIL
WTI buyers continue to support price action with the commodity forming a sustained rally. WTI has reached the target of $65 per barrel yet has pulled back in recent trading to test the ascending trendline. RSI has broken the 70 resistance area and MACD has stalled in bullish territory.
Follow Us on Facebook:
Sign up to get started
LIQUIDITY
PROVIDERS