A Breakout Imminent For Silver?
- 16 Dec 2019
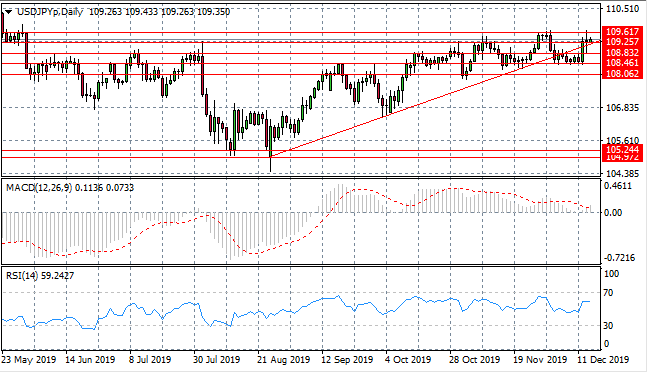
USD/JPY
The USD/JPY pair has moved to form a moderate break of the ascending trendline, with price action also testing the 109.25 resistance line. A break indicates that the U.S. Dollar has found support, the conviction of that support will be tested at the 109.61 resistance line, however, as the price level represents a recent obstacle for buyers. Momentum indicators have flattened in bullish territory.
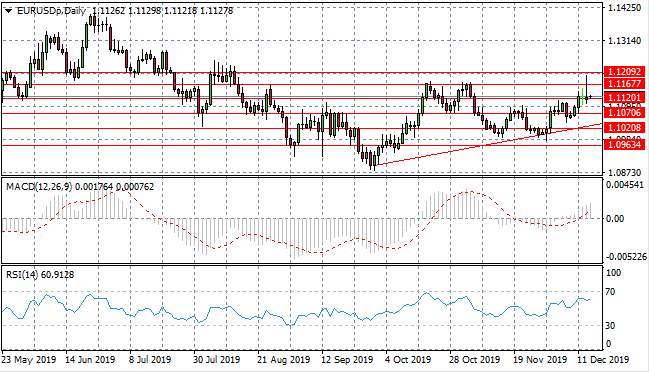
EUR/USD
The Eurodollar continues to test the 1.112 resistance line despite significant buying activity taking the pair to test the 1.120 support level in recent trading. A strong resistance level exists at the 1.116 price line where sellers have tended to return to reverse near-term direction for the pair. Momentum indicators support bullish sentiment with both forming upward trajectories.
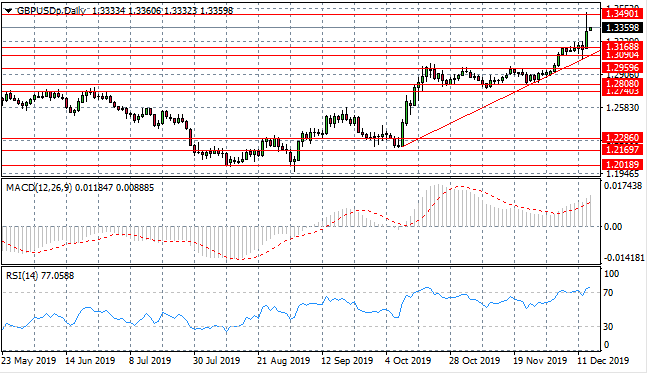
GBP/USD
The GBP/USD pair has pulled back from a long-term price high at the 1.349 price level. Selling pressure has pushed the pair back towards the 1.316 support level. Volatility may continue as geopolitical events influence the pair. Momentum indicators suggest that the pair is overbought, with RSI moving beyond the 70 resistance level.
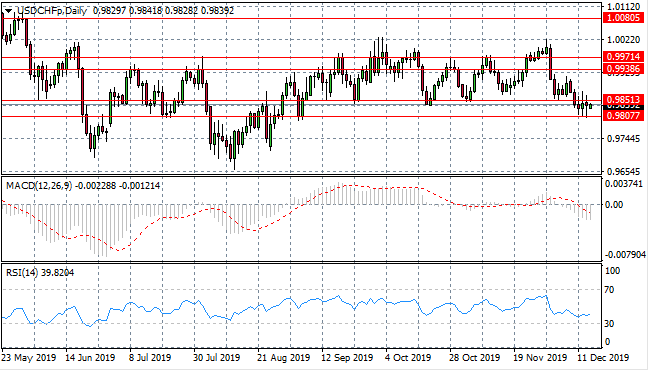
USD/CHF
The USD/CHF sell-off appears to have decelerated as a series of small-bodied candles indicate a break in the trend. Price action has stalled at the 0.985 resistance level, as buyers returned at the 0.980 support level. The break of the recent price floor at the 0.985 level is significant. Momentum indicators have flattened in bearish territory.
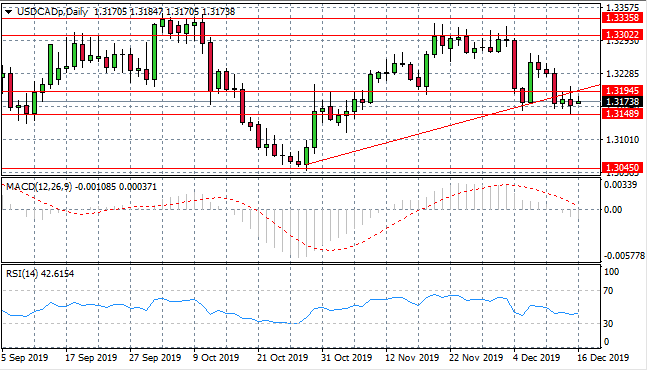
USD/CAD
The USD/CAD pair has been volatile in recent trading with price action falling back to the 1.314 support level. The pullback has resulted in a break of both the descending trendline and the 1.319 support level. A series of small- bodied candles indicate a deceleration in the downtrend. Momentum indicators have stalled in bearish conditions.
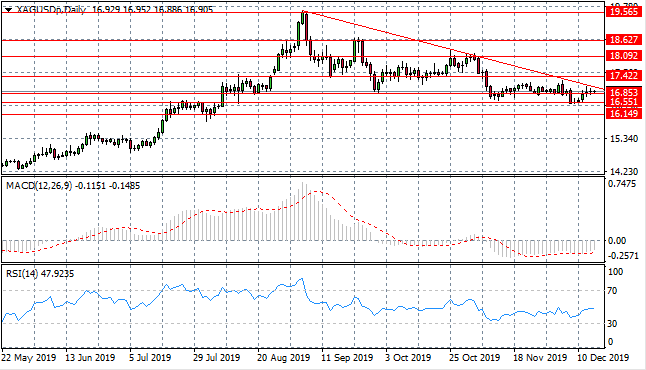
SILVER
Silver continues to hug the 16.85 support level, which has been acting as a resistance level, after a brief test of the 16.55 price level. As the pair moves closer to the ascending trendline, the likelihood of a breakout increases, as the pair enters into a descending triangle pattern. Momentum indicators remain in bearish territory.
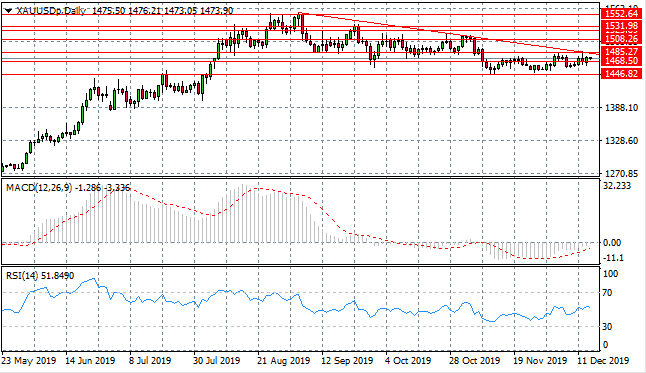
GOLD
Gold buyers have had the edge in recent price action, as the metal has once again broken the 1468.50 price level and is heading back towards the descending trendline. On each previous occasion, price action has pulled back after reaching this resistance area. Momentum indicators are beginning to move into bullish territory.
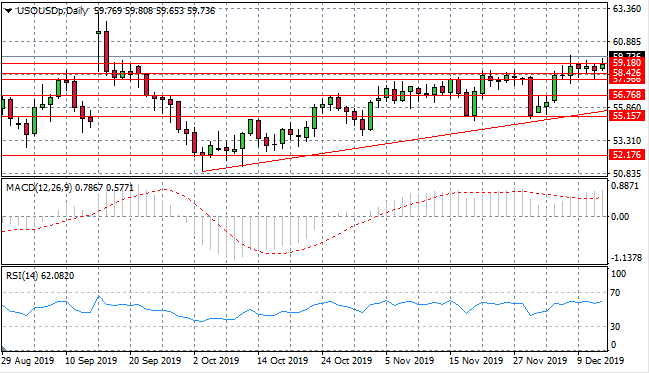
OIL
WTI price action continues to be volatile, with strong moves by both buyers and sellers. Buyers have determined the direction of price action in recent trading. Yet, despite buying pressure, the commodity has failed to move into the $60 per barrel range for any period of time. Momentum indicators have flattened in bullish territory.
Sign up to get started
LIQUIDITY
PROVIDERS