A Breakout Underway For USD/CAD?
- 29 May 2019
Kickstart your new year with the best USD50 bonus campaign. Limited-time offer! Get it now!
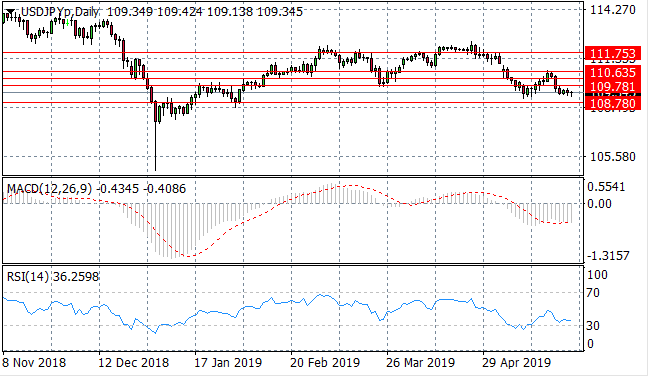
USD/JPY
The USD/JPY pair breaks another support line at the 109.78 price level as the Dollar fails to recover. The next support level is the 108.78 price line where price action has tended to recover on previous occasions. Momentum indicators are neutral; with both MACD and RSI flattening in bearish territory.
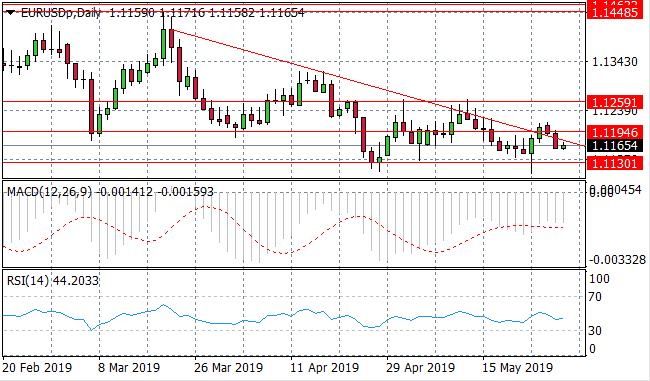
EUR/USD
The EUR/USD pair has broken the descending trendline and 1.119 price level was the next logical direction for the pair is the 1.113 price level given the longer-term downtrend. However, fundamental factors are likely to have more of an impact on this pair. Momentum indicators are moderately bearish.
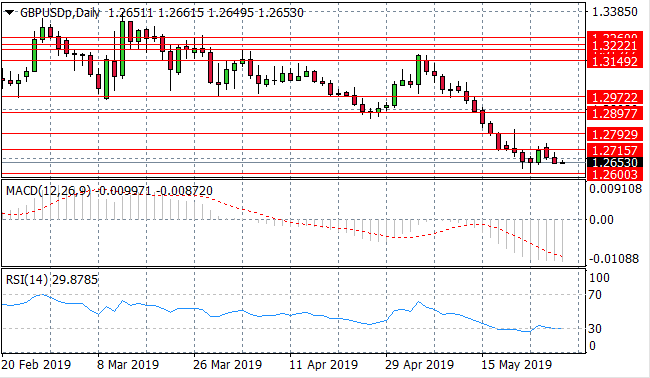
GBP/USD
The GBP/USD pair has bounced back from the 1.260 support level, yet the pair has rejected the 1.271 price level. The bearish sentiment may return with only one bullish candle in 12 days of trading. Momentum indicators have stalled in bearish territory.

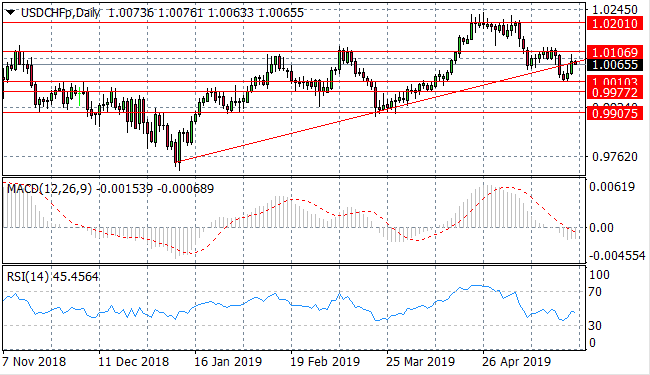
USD/CHF
The USD/CHF pair has pulled back to break the ascending trendline, which is significant, as each time the pair has tested this support level, price action has bounced back in a bullish direction. However, buyers have returned at the 1.001 support level to take price action back to test the ascending trendline once more. Momentum indicators are beginning bullish reversals.
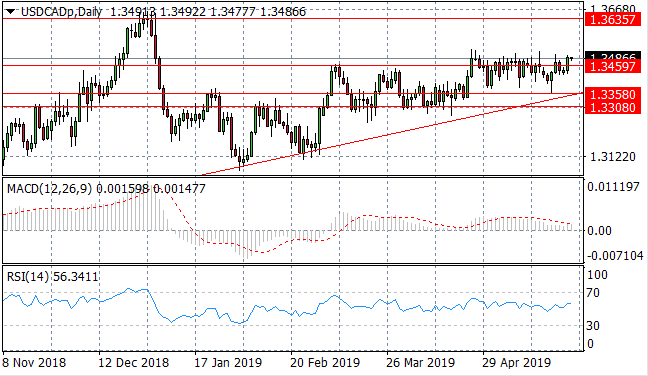
USD/CAD
The USD/CAD pair has broken the 1.345 resistance level, however, breaks generally result in a pullback in price action, to maintain the 1.330- 1.345 trading range. The pair is consolidating with a horizontal trend around the 1.345 price level and it will require fundamental factors to motivate a break out of this range. Momentum indicators remain moderately bullish.
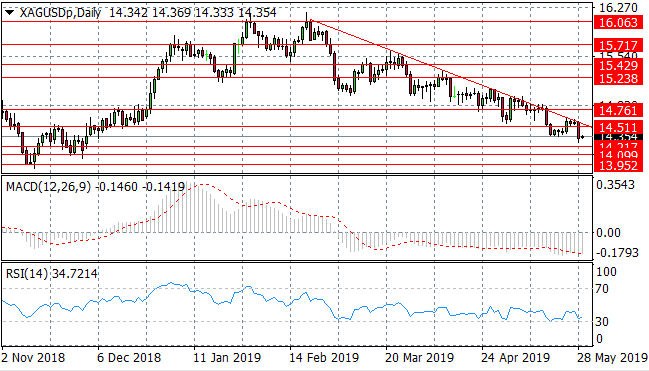
SILVER
Silver sellers continue to dominate price action in the long-term as the metal has oscillated in a bearish direction since February. The descending trendline represents a key resistance level for the metal, which price action has failed to break on a number of occasions. Momentum indicators remain bearish.
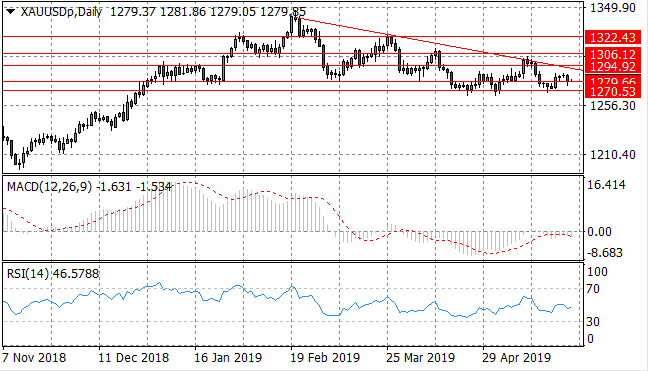
GOLD
Gold has found support at the 1279.66 price level maintaining the longer-term downtrend. The descending trendline remains a strong resistance area for the metal. Momentum indicators are bearish flattening below support levels.
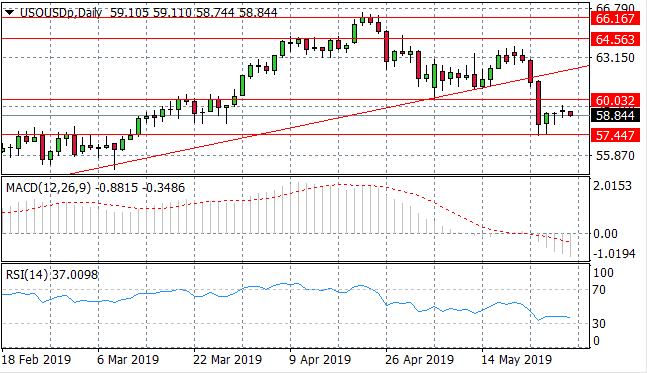
OIL
WTI buyers returned once price action reached the 57.44 support level and now price action is likely to stabilise at the $60 per barrel range. Momentum indicators suggest sentiment remains bearish; with RSI flattening above the 30 support level and MACD extending further into bearish territory.
Follow Us on Facebook:
Sign up to get started
LIQUIDITY
PROVIDERS