Bearish Reversal For USD/JPY Pair?
- 19 Sep 2019
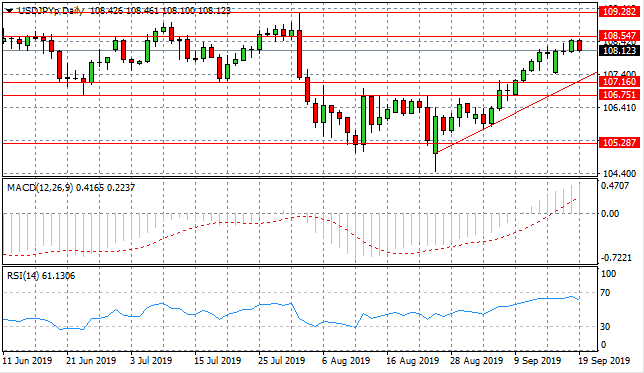
USD/JPY
The USD/JPY pair has fallen back before reaching the 108.54 resistance level. A series of doji candles indicated a slowdown in the pair, resulting in the first bearish candle today in the last 12 trading days. Price action may head back towards the ascending trendline. Momentum indicators are bullish; with MACD breaking the zero line yet RSI has flattened just below overbought conditions.
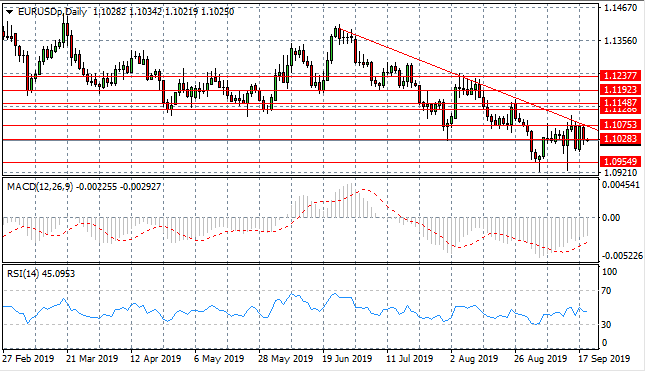
EUR/USD
The Euro has once again rebounded from the descending trendline, taking price action back towards the 1.102 support level. A bearish breakout may be imminent as the pair moves towards the apex of a descending triangle with the 1.102 price level rpresenting a floor. Momentum indicators have stalled in bearish territory.
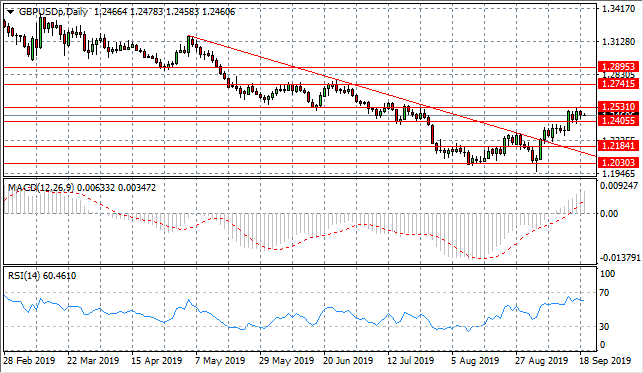
GBP/USD
The GBP/USD pair was unable to break the 1.253 resistance area and as such, sellers have returned to the pair. The next target is the 1.240 support level. A pullback may signal the end of the rally and a return to the longer-term downtrend. Momentum indicators are bearish; with MACD heading towards the zero line and RSI moving away from overbought conditions.
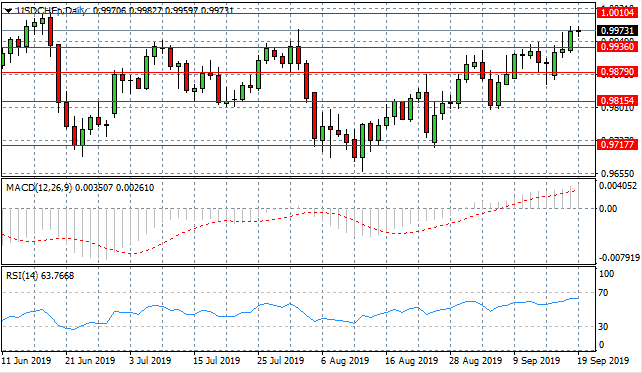
USD/CHF
The USD/CHF pair has broken the 0.993 resistance line in a strong bullish move. The next resistance level lies at the 1.001 price line. The rally may come to an end at this resistance level, however, as has been the case on previous occasions, where sellers have returned to dominate. Momentum indicators remain bullish although their trajectory has flattened in recent trading.
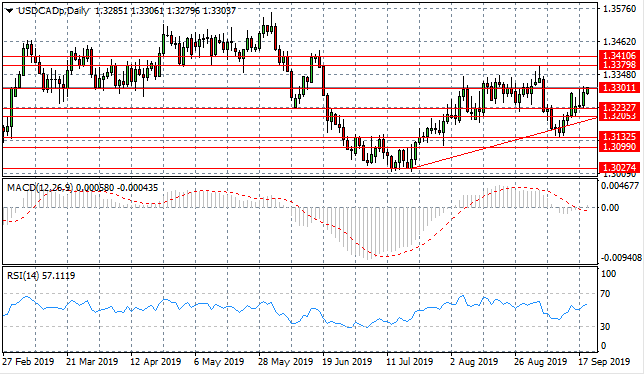
USD/CAD
The USD/CAD pair continues to rally despite a rise in selling pressure in recent trading. The pair may head towards the 1.330 resistance line yet the 1.323 resistance line appears to be a sticking point for the rally. Momentum indicators are turning more bullish with MACD testing the zero line and RSI moving into the buying channel.
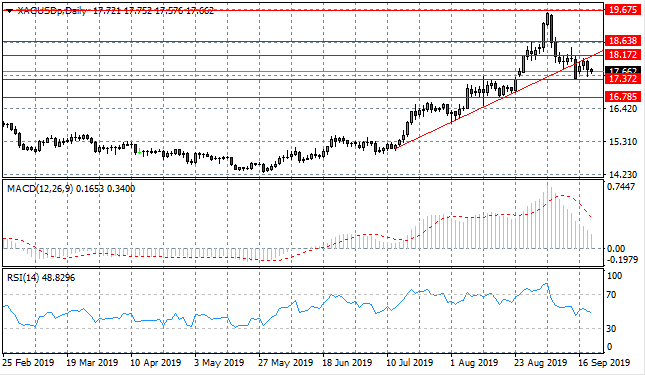
SILVER
Silver’s price volatility has been high in recent trading as price with neither buyers or sellers dominating price action over the last week. The metal has fallen back from an extended rally and is now beginning to move sideways within the 17.37 and 18.17 trading range. Momentum indicators are bearish; with MACD heading towards the zero line yet and RSI breaking the default line to the downside.
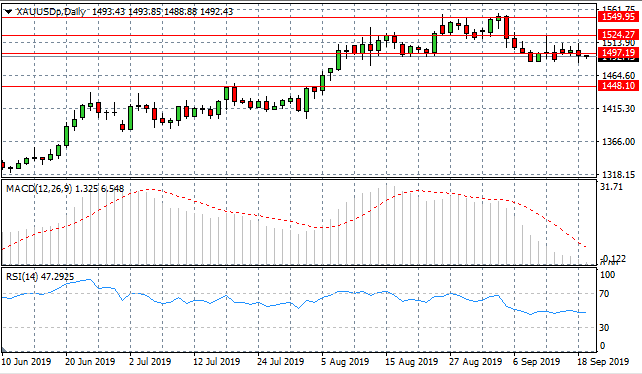
GOLD
Gold continues to test the 1497.19 support level with a series of small-bodied candlesticks indicating indecision, however, overall sentiment appears bearish. The next likely target for price action is the 1448.10 support level. Momentum indicators are neutral if moderately bearish, with MACD heading towards the zero line and RSI flattening just below the default line.
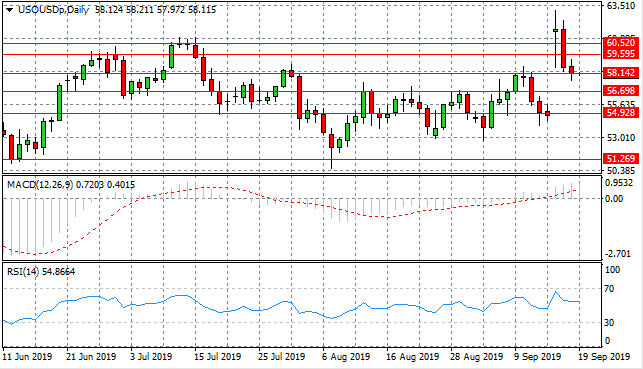
OIL
WTI price spiked on supply concerns related to recent geopolitical developments. A full bearish reversal has taken place and price action is now testing the 58.14 price level which has been a key resistance area in the past. Momentum indicators are bullish with MACD breaking the zero line to the upside yet RSI has flattened in the bullish channel.
Sign up to get started
LIQUIDITY
PROVIDERS