Silver Tests Key Resistance Level
- 16 Jul 2019
Kickstart your new year with the best USD50 bonus campaign. Limited-time offer! Get it now!
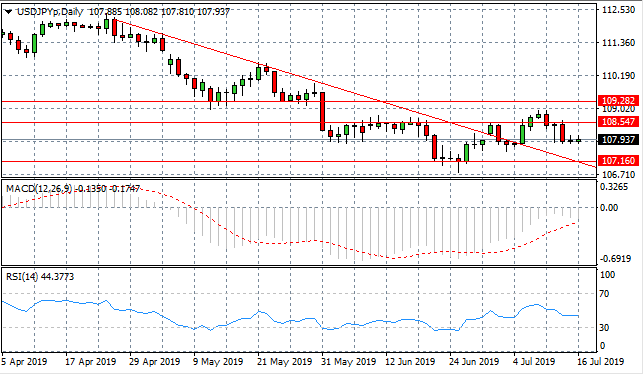
USD/JPY
The USD/JPY pair has broken the resistance line at the 108.54 price level and is heading back towards the descending trendline. A trading range between the 107.16 and 108.54 price levels may have been established, considering price action has struggled to move beyond the 108.54 price level on numerous occasions. Momentum indicators remain in bearish territory.
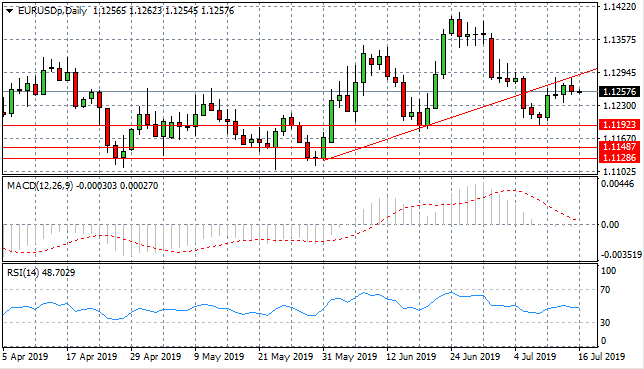
EUR/USD
EUR/USD buyers’ appetite has returned, however, the ascending trendline has become a strong resistance level for the pair. This calls into question the uptrend that was beginning to form. Momentum indicators are neutral with MACD testing the zero line and RSI stalling at the default line.
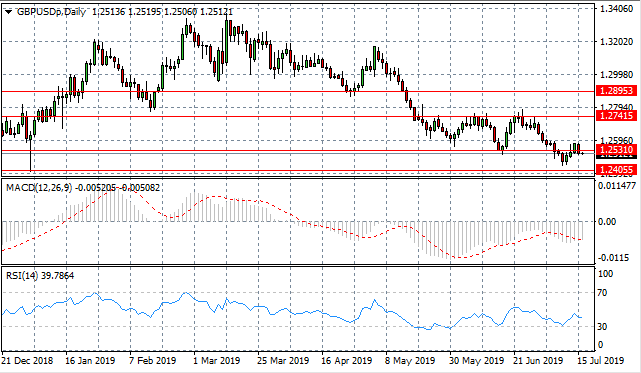
GBP/USD
The GBP/USD pair has finally made a recovery and is once again testing the 1.253 support level. The pair may return to the 1.253 and 1.274 trading range, however, buyers are struggling to gain any traction. Momentum indicators remain in bearish territory with upward trajectories.

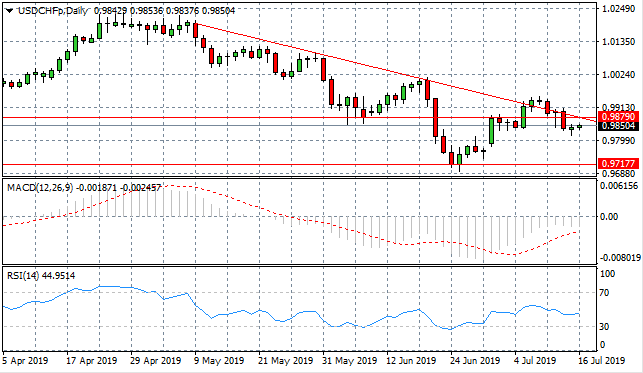
USD/CHF
The USD/CHF pair’s rally has proven short-lived as dollar weakness remains. The pair has broken back below the descending trendline and the 0.985 support level, as the downtrend becomes more established. Momentum indicators remain in bearish territory though there is no strong directional bias.
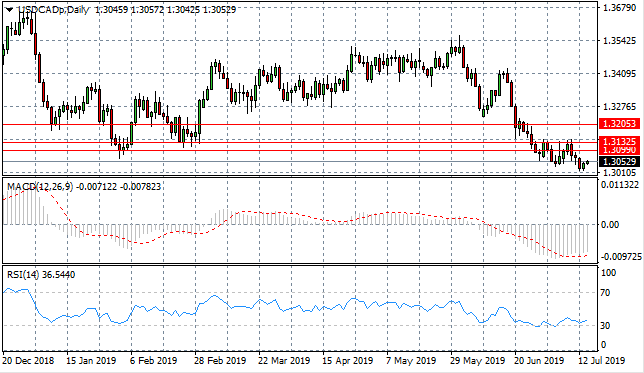
USD/CAD
The USD/CAD pair has entered into a horizontal trading pattern where neither buyers nor sellers are dominating the pair’s direction after an extended bearish period. Momentum indicators remain bearish although have flattened in oversold territory.
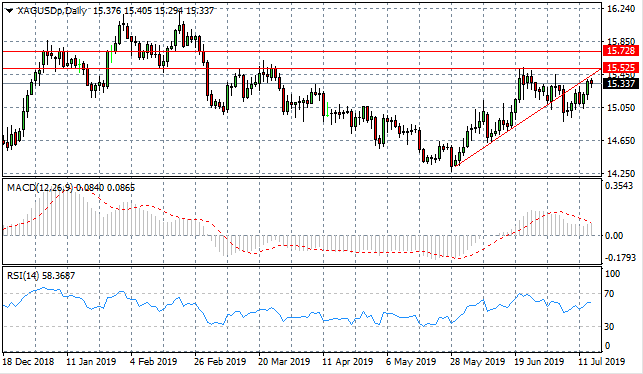
SILVER
Silver is once again testing the ascending trendline which is fast becoming a resistance level for the metal. Price action is approaching the 15.52 resistance line and a break would provide further impetus to buyers. Momentum indicators remain in bullish territory and there is room for further upside.
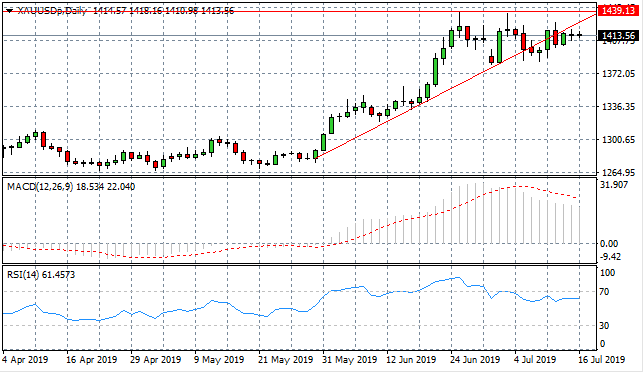
GOLD
Selling pressure has taken Gold to break the ascending trendline, however, a series of doji candles represent a stall in price action. Market participants are waiting in anticipation of upcoming macroeconomic events. Momentum indicators have pulled back from strongly bullish positions. RSI has broken below the 70 resistance line indicating a momentum reversal.
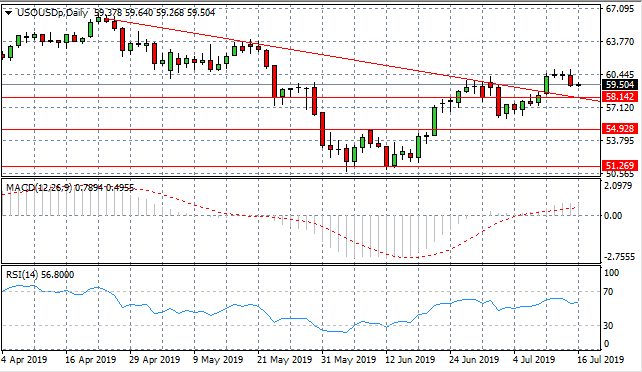
OIL
WTI has once again retraced from the $60 per barrel range, as a series of doji candles represented indecision at this price level. Sellers have returned taking price action back towards the descending trendline and the 58.14 support level. Momentum indicators support bullish sentiment with further upside potential, despite RSI approaching overbought conditions.
Follow Us on Facebook:
Sign up to get started
LIQUIDITY
PROVIDERS