The End Of Gold’s Bullish Run?
- 17 Jul 2020
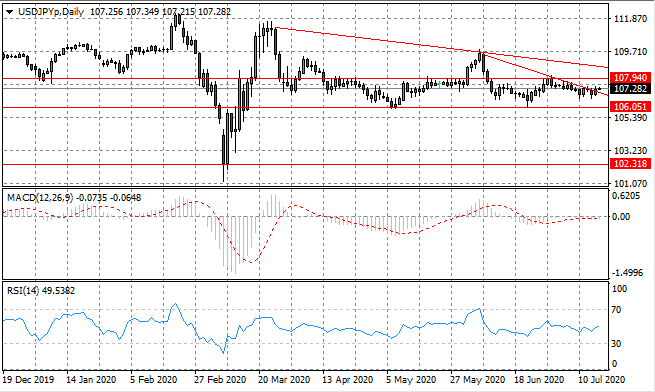
USD/JPY
The USD/JPY pair has broken a shorter term descending trendline indicating that buyers are building momentum. A breach of the 107.92 resistance line is yet to take place as buyers, so far, have lacked the appetite to drive a trend change. A longer-term bearish bias remains. Momentum indicators have flattened in neutral/bearish territory.
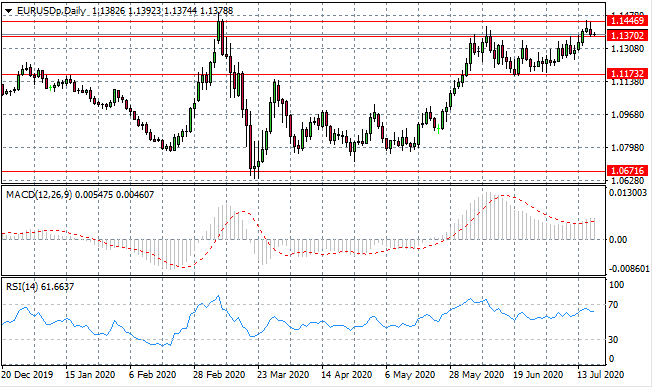
EUR/USD
The Eurodollar surge has begun to reverse as sellers returned once again at the 1.144 resistance line. As such price action is now testing the 1.137 support level as the pair may return to a previous trading range. Momentum indicators remain in bullish territory yet RSI has a downward trajectory.
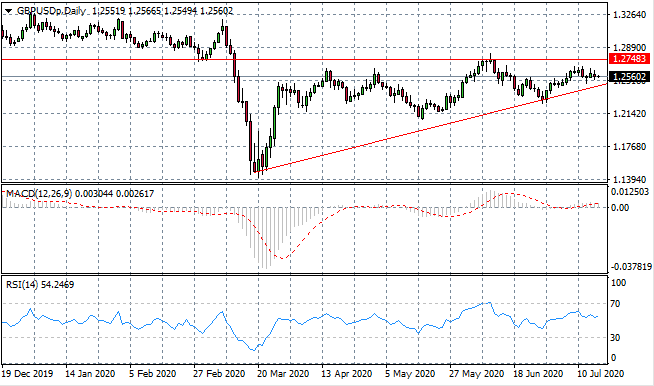
GBP/USD
The GBP/USD oscillations appear to be narrowing which may hint at a potential breakout especially as the pair heads towards the apex of the ascending triangle. Sellers appear to be having more influence in current price action which is once again heading towards the ascending trendline, where previously, bullish rebounds have taken place. Momentum indicators are slightly bullish yet are flattening.
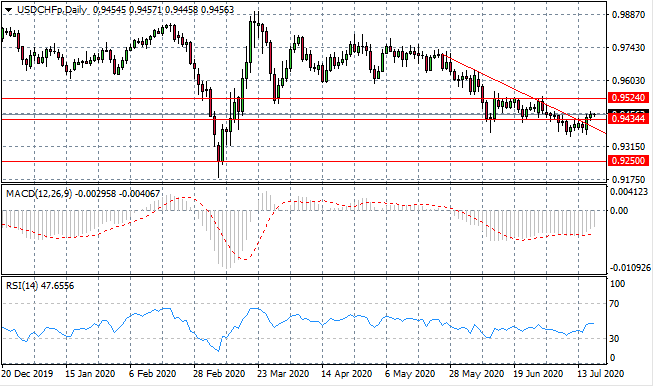
USD/CHF
The USD/CHF pair has broken both the descending trendline and the 0.943 support level which is significant as it represents a trend reversal. The next target is the 0.952 resistance line as buyers appear to be sustaining the break in the early Asian trading session. The target represented a key obstacle for buyers during a previous period of consolidation. Momentum indicators are beginning upward trajectories.
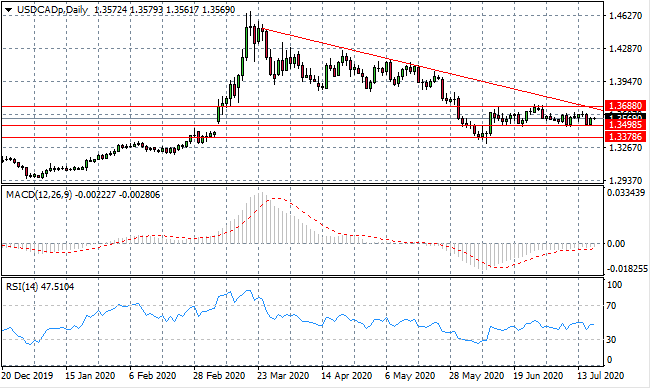
USD/CAD
The USD/CAD pair has returned to test the first line of defense at the 1.349 price line, which has resulted in a bullish rebound. The next target is most likely to be the descending trendline which has been established as a resistance line for the pair marking a bearish trend. Momentum indicators have flattened in bearish/neutral territory.
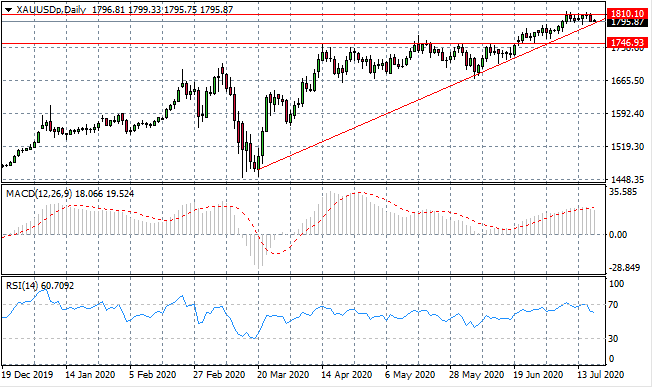
GOLD
Gold buyers have struggled to move beyond the 1810.10 resistance area and as such, the metal has pulled back to the ascending trendline. Previous tests of the trendline have resulted in bullish revivals, therefore the recent move may represent a retracement before the metal moves higher. Momentum indicators show that the pair may be overbought and that there is potential for a reversal.
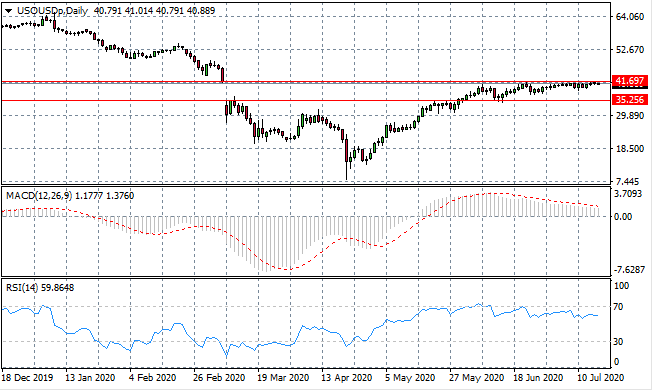
OIL
WTI buyers appear to be making yet another attempt at the resistance line. A break would clearly be significant given the difficulty buyers appear to have had in previous attempts and that appears to be the case, once again, in today’s trading session. Momentum indicators have flattened in bullish territory.
Sign up to get started
LIQUIDITY
PROVIDERS