The End Of The USD/CHF Rally?
- 15 Oct 2019
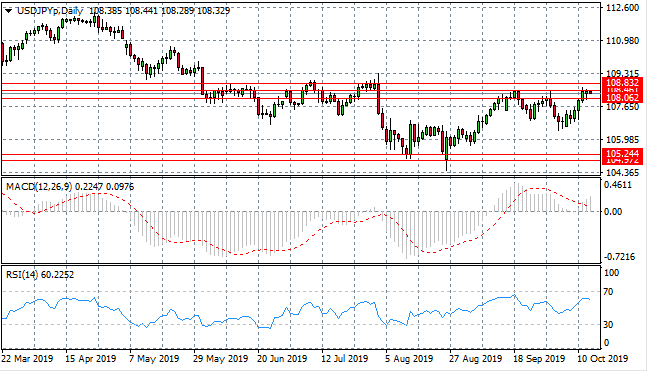
USD/JPY
The USD/JPY pair is stuck at the 108.46 resistance line as price volatility begins to decline. Small bodied candles represent indecision from buyers and sellers. It appears unlikely that the pair will be able to move beyond the 108 price ceiling. Momentum indicators reflect the stall in bullish sentiment.
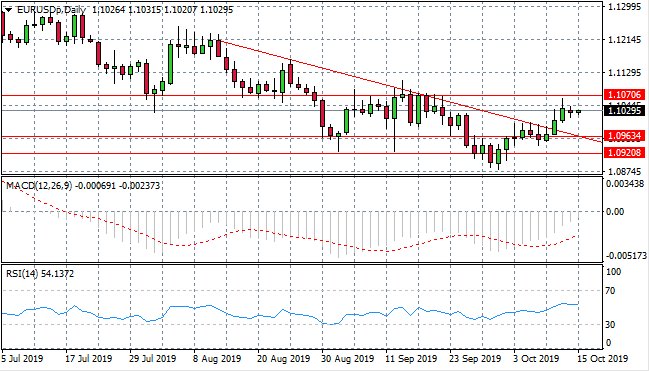
EUR/USD
The Eurodollar has broken the descending trendline and is now heading towards the 1.107 resistance line. The break has been met with rising selling pressure, however, despite bullish price action. The resistance area therefore will likely remain intact. Momentum indicators have upward trajectories.
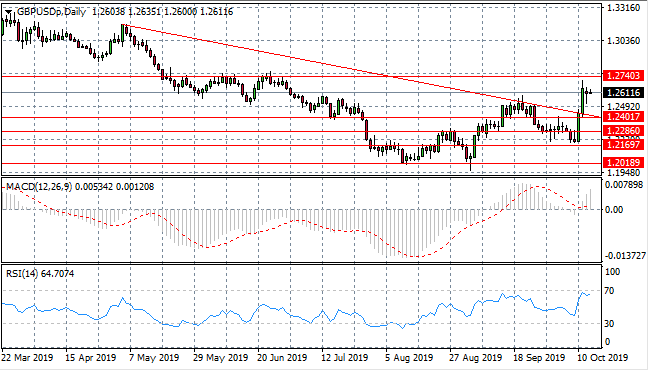
GBP/USD
The GBP/USD pair has enjoyed strong optimism in recent trading, due to geopolitical developments. Rising buying pressure in the pair is keeping price action at the 1.261 price level yet buyers lack the conviction to drive prices towards the 1.274 resistance level. Momentum indicators are bullish, however, RSI has pulled back from overbought conditions.
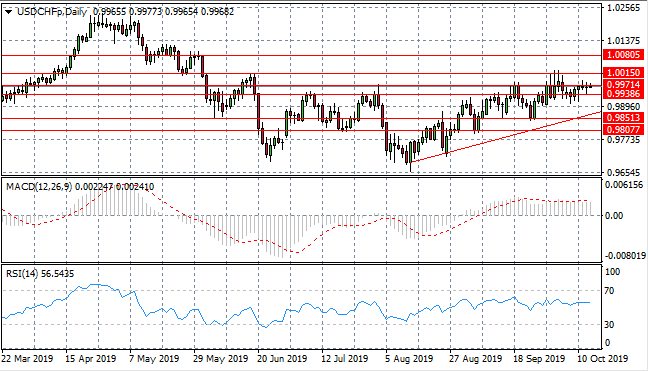
USD/CHF
The USD/CHF pair is now testing the 0.997 resistance level once again as the rally continues. Buyers appear to lack the conviction currently to push price action back towards the 1.001 resistance line. Momentum indicators have flattened in bullish territory.
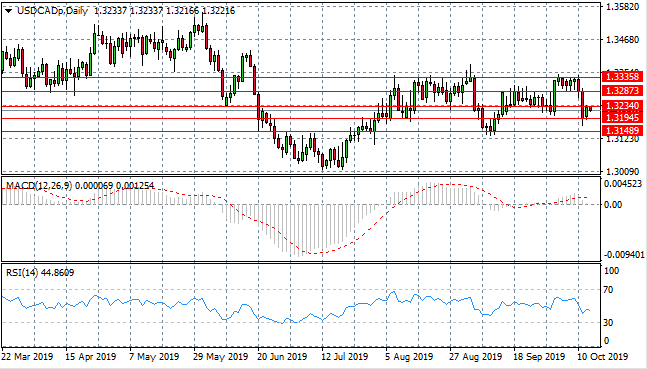
USD/CAD
The USD/CAD pair continues to test the 1.323 support area where after a bullish rebound from the 1.319 price area. Price action is likely to oscillate between the 1.314 and 1.333 price levels, which represent a recent trading range. Momentum indicators are languishing in neutral territory.
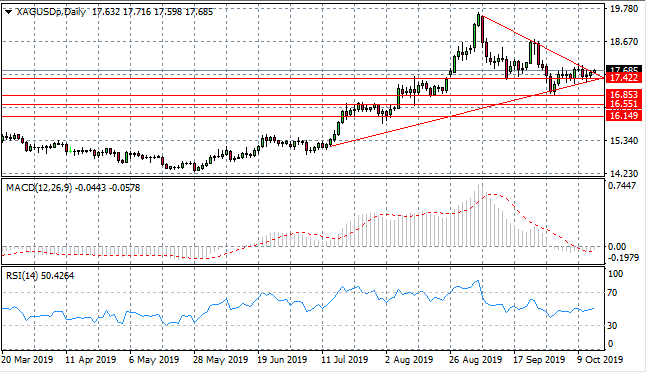
SILVER
Silver has broken the upperbound of a symmetrical triangle indicating a bullish breakout is underway, as a continuation of a previous uptrend. Price action will likely pull away from the 17.42 support level. Momentum indicators have begun upward trajectories.
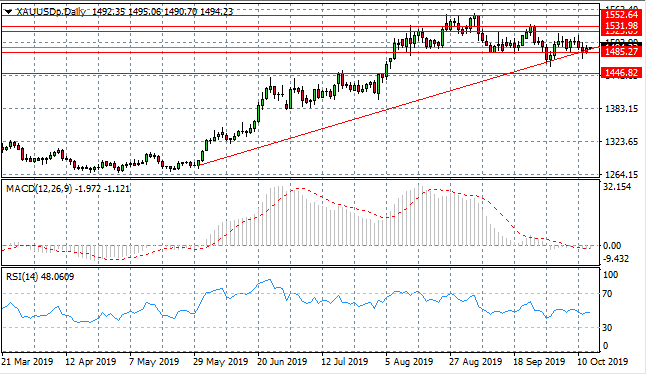
GOLD
Gold has been trading horizontally, within a tight trading range recently. Price action is testing the ascending trendline, which has been acting as a key support level. There appears to be indecision from market participants as a series of doji candles gather around the support area. Momentum indicators remain in neutral/bearish territory.
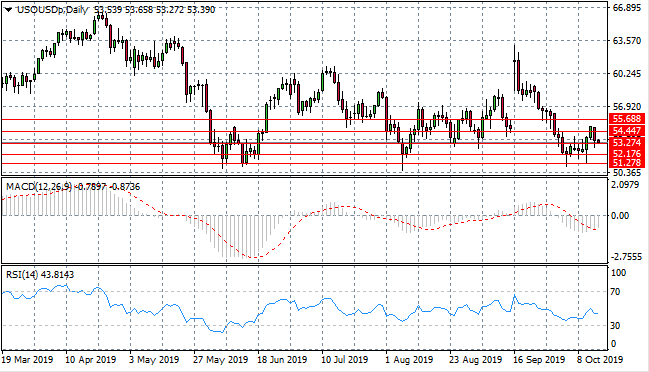
OIL
WTI price volatility continues with another break of the 54.44 price line. Price action is now testing the 53.27 support level with another strong support present at the 52.17 price level. Momentum indicators have a moderate upward trajectory.
Sign up to get started
LIQUIDITY
PROVIDERS