Further Downside Risk For WTI
- 31 May 2019
Kickstart your new year with the best USD50 bonus campaign. Limited-time offer! Get it now!
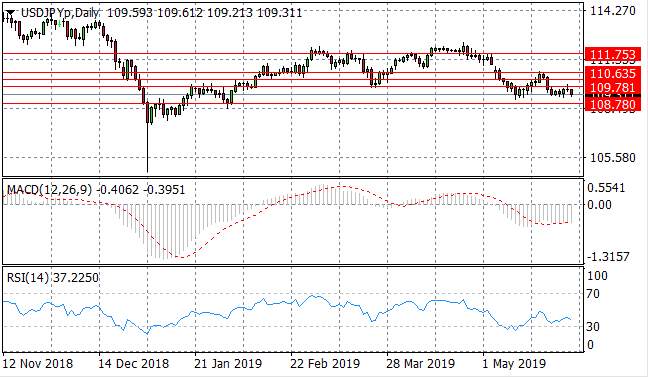
USD/JPY
The USD/JPY pair breaks another support line at the 109.78 price level as the Dollar fails to recover. The next support level is the 108.78 price line where price action has tended to recover on previous occasions. Momentum indicators are neutral; with both MACD and RSI remaining in bearish territory.
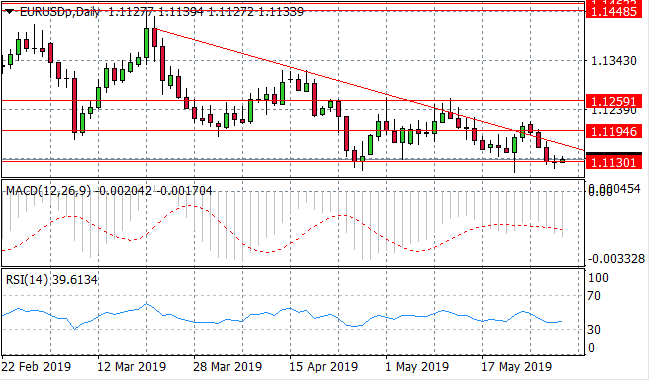
EUR/USD
The EUR/USD pair has broken the descending trendline and 1.119 price level and the pair is now testing the 1.113 price level. This has proven to be a strong support area on previous occasions with price action bouncing into a rally. However, fundamental factors are likely to have more of an impact on this pair. Momentum indicators are moderately bearish.
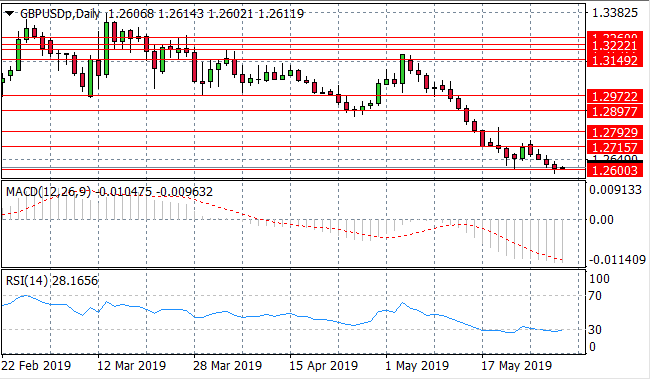
GBP/USD
The GBP/USD pair is once again testing the 1.260 support level after rejecting the 1.271 price level. In 20 days of trading for the pair, 18 candles have been bearish indicated deep negative sentiment for the pound currently as a result of geopolitical tensions. Momentum indicators have flattened in bearish territory.

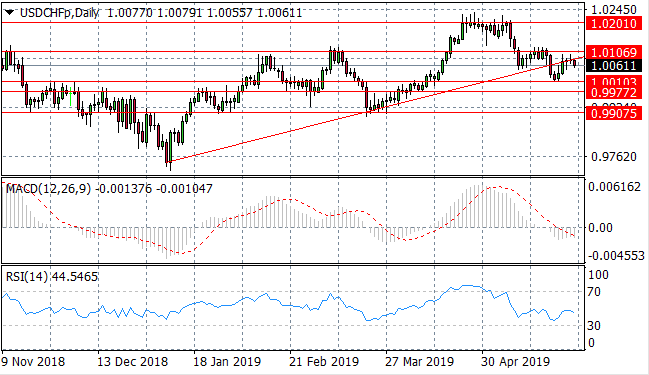
USD/CHF
The USD/CHF pair has pulled back to break the ascending trendline and is continuing to test the trendline to the upside having bounced back from the 1.001 price level. A break would mean the end of the pullback and resumption of the previous uptrend. Momentum indicators remain bearish.
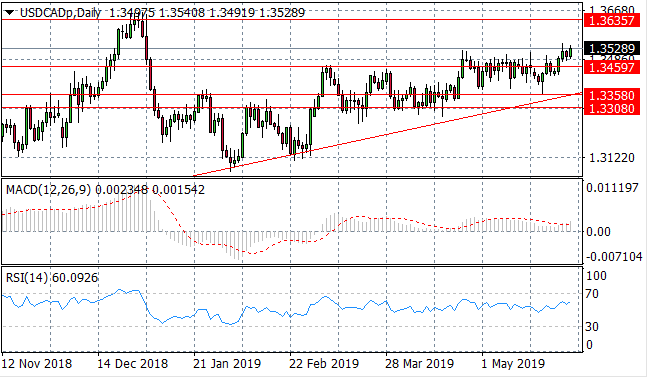
USD/CAD
The USD/CAD pair has broken the 1.345 resistance level and a horizontal trading range, as a rally has begun to take place which may see price action approach a previous high at the 1.363 resistance line. Momentum indicators support the bullish bias.
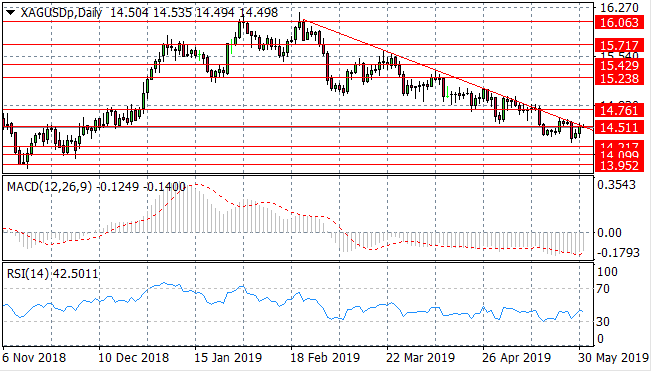
SILVER
Silver sellers continue to dominate price action in the long-term as the metal has oscillated in a bearish direction since February. The descending trendline represents a key resistance level for the metal, which price action has failed to break on a number of occasions. Momentum indicators remain in bearish range.
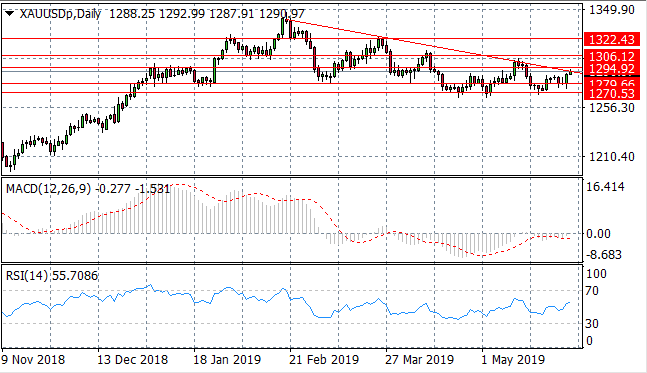
GOLD
Gold has found support at the 1279.66 price level maintaining the longer-term downtrend. The descending trendline remains a strong resistance area for the metal. Momentum indicators are mixed; with MACD remaining in bearish territory however, RSI has begun a bullish reversal which may be the first indication of a trend change.
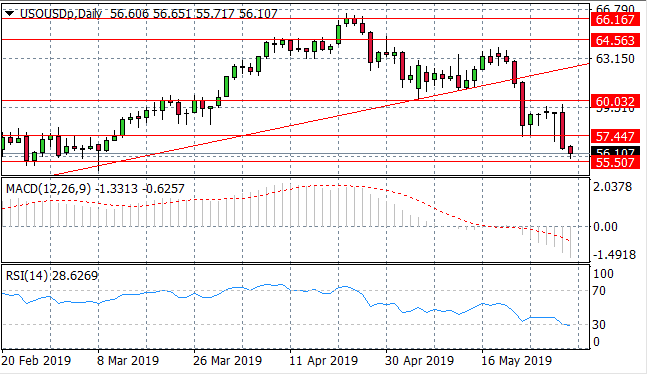
OIL
WTI sellers have forced price action to a new support area at the 55.50 price level. WTI has previously consolidated in this price range, representing a key resistance area for the commodity at the beginning of this year. Momentum indicators are significantly bearish which may suggest further downside; as MACD extends into negative territory and RSI tests the 30 support level.
Follow Us on Facebook:
Sign up to get started
LIQUIDITY
PROVIDERS