Mid-Week Volatility For Precious Metals
- 4 Jun 2020
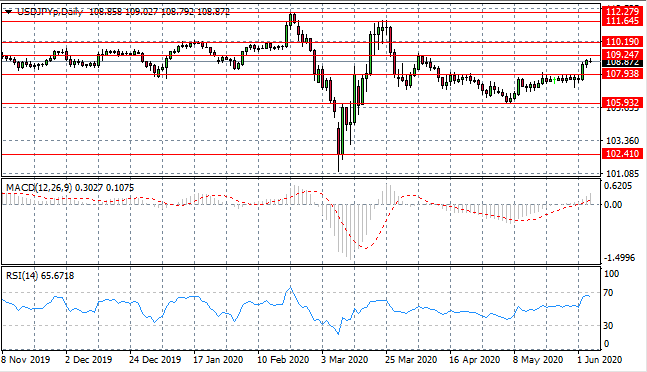
USD/JPY
The USD/JPY pair is moving towards the 109.24 resistance level yet momentum is slowing as buyers conviction appears to be waning. Momentum indicators remain in bullish territory, yet RSI is curling back from overbought conditions indicating the current rally may not last.
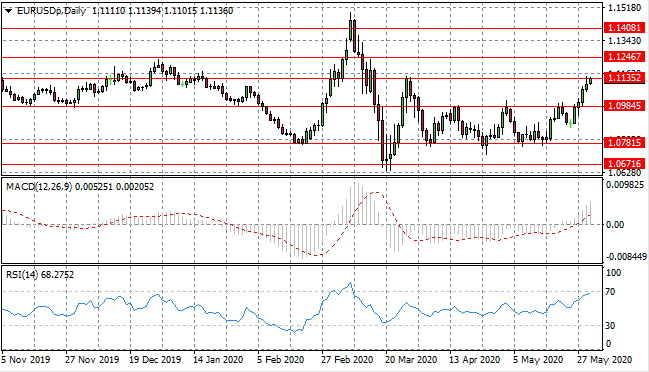
EUR/USD
The Eurodollar has begun to test the 1.113 resistance line, as the rally begins to build momentum. A target exists at the 1.124 price level and represents the ceiling of a previous trading range. Momentum indicators have turned bullish with RSI testing the overbought ’70’ line.
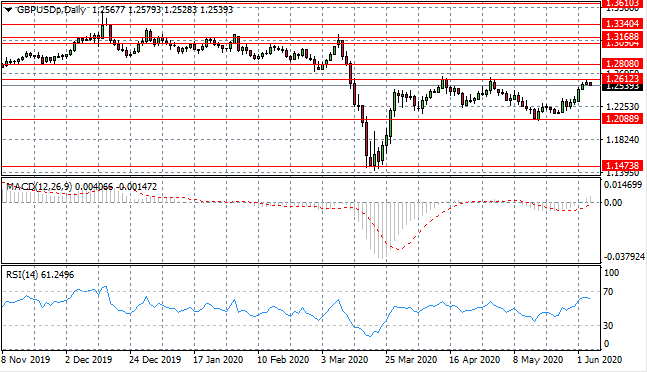
GBP/USD
The GBP/USD pair has rejected the 1.261 resistance level once again, with sellers returning to the pair. Going forward, the pair will likely continue to oscillate between the 1.208 and 1.261 price levels. Momentum indicators remain in bullish territory though fell short of the overbought resistance line at 70.
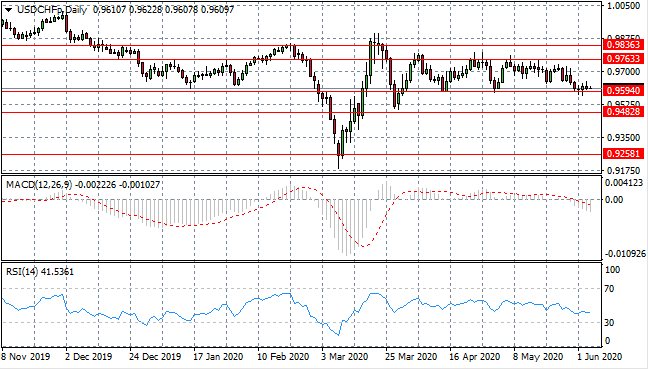
USD/CHF
The USD/CHF pair has returned to test the 0.959 support level as sentiment has turned bearish in recent trading. A stall has occurred at this price level where small-bodied candles indicate indecision or consistent inability to push price action beyond the support line. Momentum indicators have flattened in bearish territory.
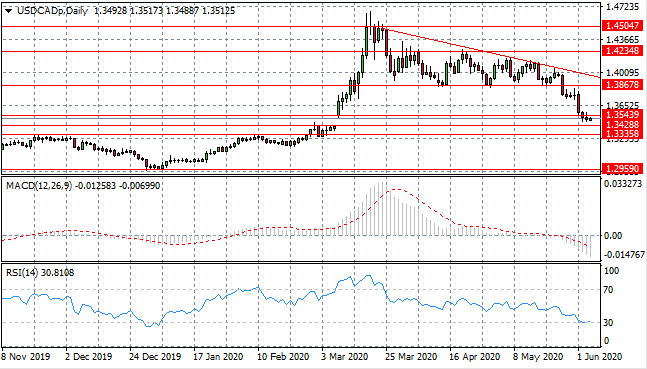
USD/CAD
The USD/CAD breakout has gathered significant support, taking price action towards the 1.342 support level as the pair returns to previous levels seen before the Covid-19 breakout. Momentum indicators have downward trajectories, yet RSI has hit the 30 oversold line.
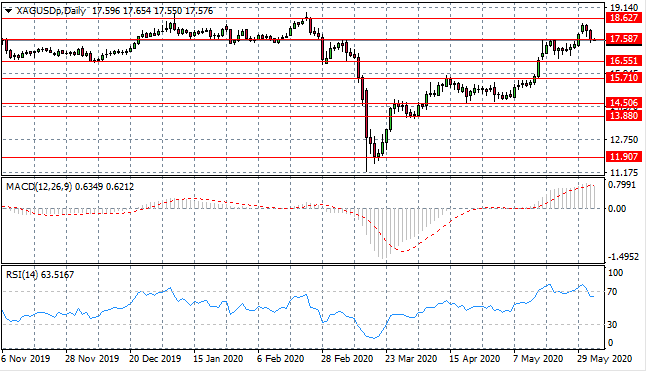
SILVER
Silver has returned to the 17.58 resistance level after a brief break which looked like the metal may take off a reach new highs. The pullback may be a short rest period before another drive higher. Momentum indicators appear to be undergoing reversals with RSI heading back to break below the 70 resistance line.
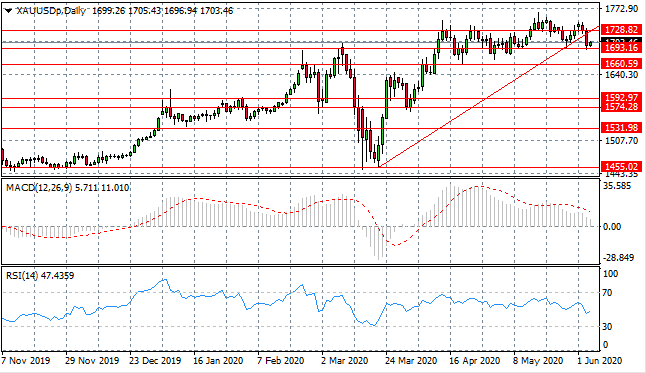
GOLD
Gold sellers dominated price action in yesterday’s trading which saw the 1728.82 support level as well as the ascending trendline. Yet a stall occurred at the 1693 price level where another attempt will likely be made by buyers to drive the metal higher. Momentum indicators have bearish trajectories.
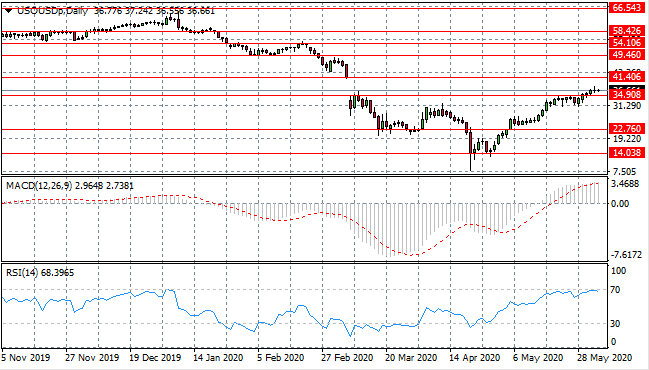
OIL
WTI has finally broken the 34.90 resistance level, which is significant as it represents a gap fill line from the previous downtrend. If price action can reach and break the 41.40 price level we can expect the rally to gain traction. Momentum indicators remain in bullish territory although RSI is testing overbought conditions.
Sign up to get started
LIQUIDITY
PROVIDERS