Pound And Euro Rates Reach Multi-Year Lows
- 1 Aug 2019
Kickstart your new year with the best USD50 bonus campaign. Limited-time offer! Get it now!
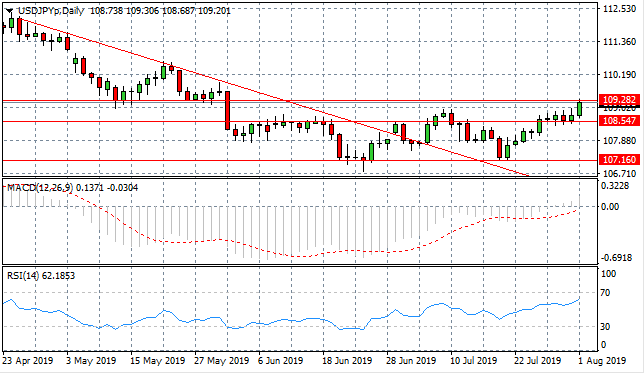
USD/JPY
The USD/JPY pair is testing the 109.28 price level which has represented a strong resistance area in the past. The pair has been trading within the 107.16 and 109.28 price range and this seems likely to continue. Momentum indicators are approaching overbought conditions as RSI approaches the 70 resistance level and MACD breaks the zero line.
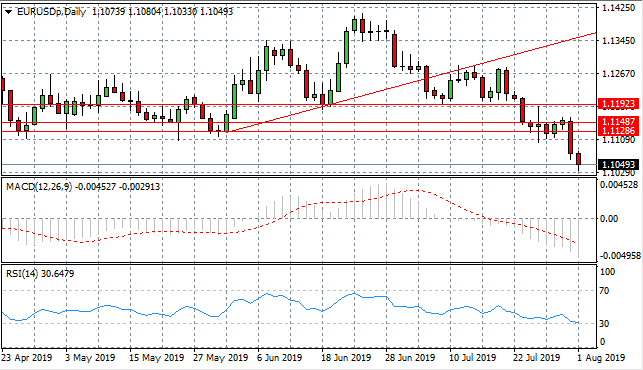
EUR/USD
EUR/USD has reached multi-year lows after breaking the 1.112 price floor. Sellers appear to have strong conviction denoted by the long bodies of the bearish candles. Momentum indicators are extending their positions into bearish territory yet RSI has reached oversold conditions; testing the 30 support level.
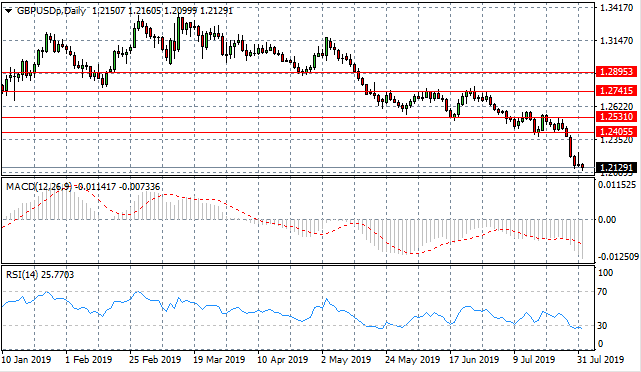
GBP/USD
The GBP/USD pair has broken the trading range between the 1.240 and the 1.253 price levels, representing yet another multi-year low. The break confirms a longer-term downtrend for the pair as the economy stalls and political uncertainty rises. Momentum indicators remain bearish, with RSI approaching and flattening in oversold conditions.

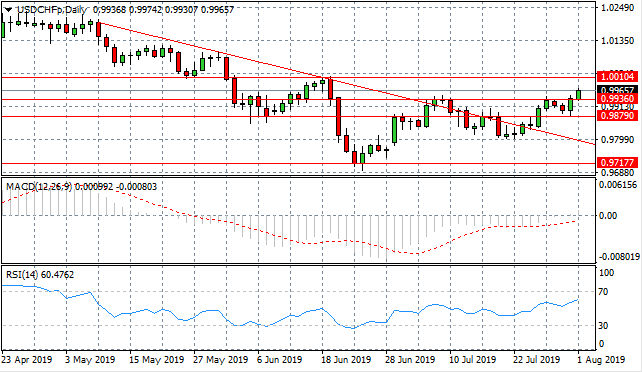
USD/CHF
The USD/CHF pair has broken the 0.993 price level as the US Dollar rally begins to gain traction. The next target is the 1.001 price level. Momentum indicators are bullish; with MACD testing the zero line and RSI approaching the 70 resistance level.
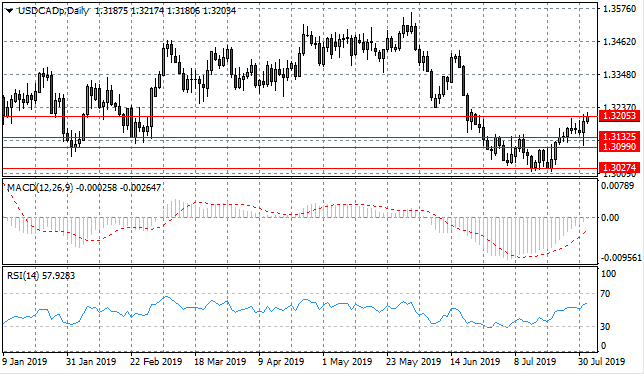
USD/CAD
The USD/CAD pair continues to test the 1.320 resistance line but is yet to break this price level, despite several attempts. The pair will likely trade in the range between 1.302 and 1.320 price levels going forward. Momentum indicators are sharply bullish with MACD testing the zero line and RSI approaching oversold conditions.
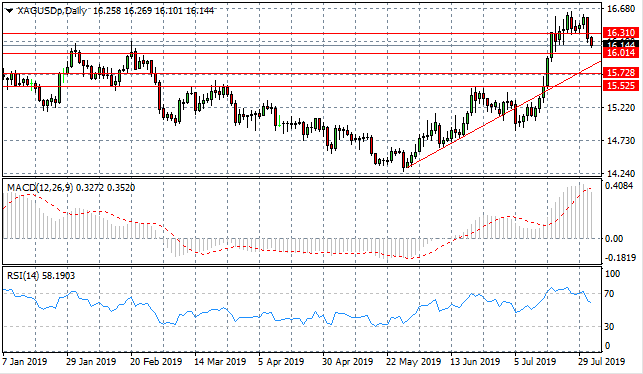
SILVER
Silver has broken the 16.31 support level, with the next obvious support level at 16.01 and the pair may head back towards the ascending trendline. Momentum indicators are also pulling back from overbought conditions with MACD beginning a downward trajectory and RSI breaking the 70 resistance line.
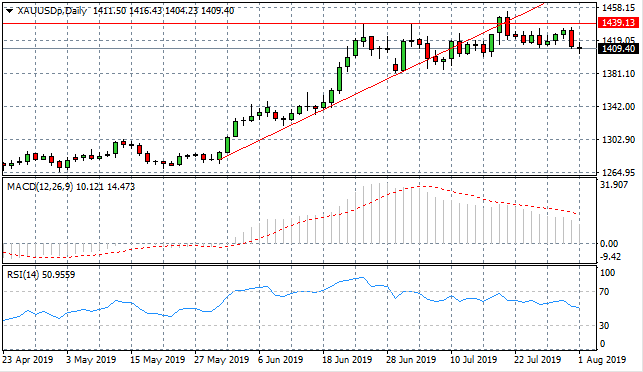
GOLD
Gold has rejected both the 1439.13 resistance line and the ascending trendline as sellers have returned. Trading seems to still be moving horizontally- denoted by a series of doji candles, despite selling pressure rising in recent trading. Momentum indicators are also pulling back from overbought conditions in apparent bearish reversals.
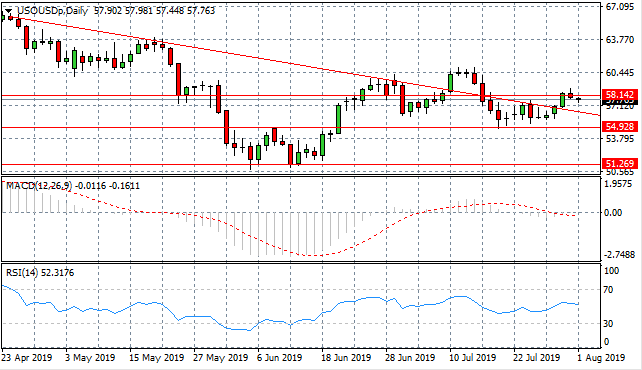
OIL
WTI continues to oscillate around the descending trendline with price action rejecting the 58.14 resistance line. The descending trendline no longer appears to be a resistance area for the commodity. Rising bearish momentum may take price action to the 54.92 support level. Momentum indicators are bearish, with MACD breaking the zero line to the downside and RSI flattening at the default line.
Follow Us on Facebook:
Sign up to get started
LIQUIDITY
PROVIDERS