Eurodollar Reaches Multi-Year Lows
- 13 Feb 2020
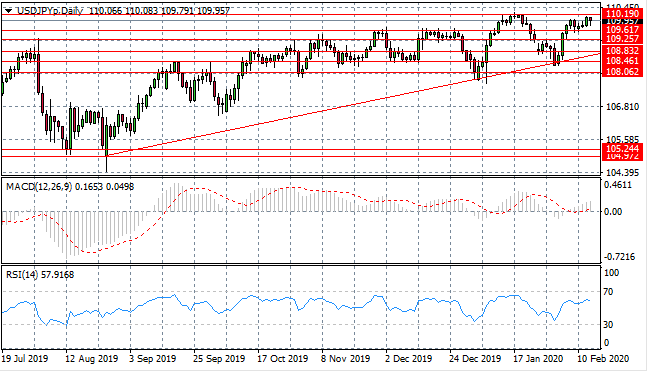
USD/JPY
The USD/JPY pair is edging closer to the 110.19 resistance line which represents a price ceiling in recent trading. A hammer candlestick indicates that despite selling activity in yesterday’s trading, a key area for demand was hit which encouraged bulls to return. Momentum indicators have upward trajectories.
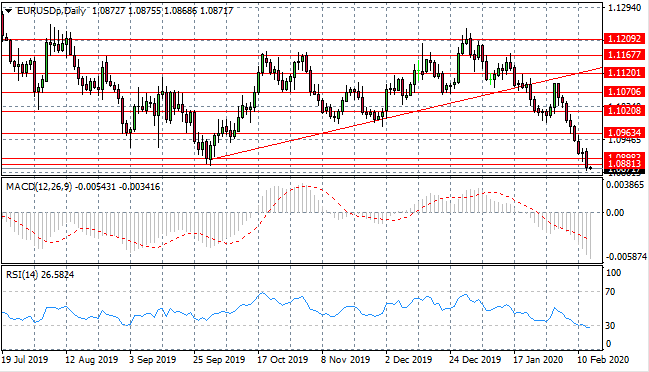
EUR/USD
The Eurodollar has hit a multi-year price low having broken the 1.088 support level in the most recent bearish move. The last nine trading session have been bearish underlining seller dominance. Momentum indicators support the bearish sentiment with RSI testing the 30 oversold support level.
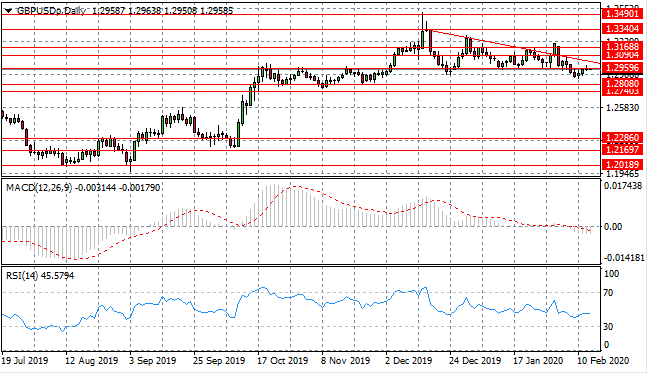
GBP/USD
The GBP/USD pair continues to test the 1.295 support level, where a previous break was immediately met with rising buying pressure. The next target is likely to be the descending trendline which has acted as a key resistance area in the past. Momentum indicators are moderately bearish.
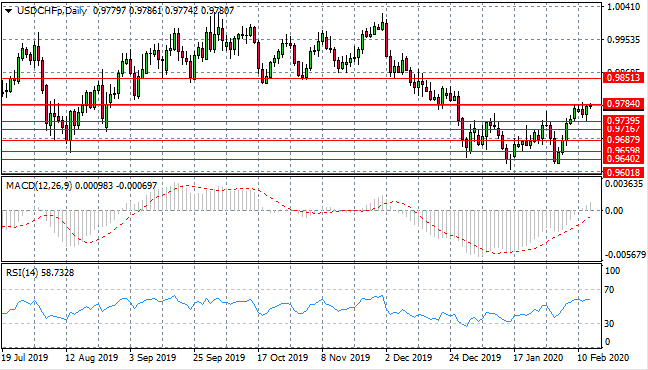
USD/CHF
The USD/CHF pair has failed to move beyond the 0.978 resistance level, despite a rise in buying activity. The question is whether US Dollar buyers have the conviction to sustain the rally. Further bullish moves may be made, however, this stall is the first sign of exhaustion in the pair. Momentum indicators have upward trajectories with MACd breaking the zero line and RSI approaching overbought conditions.
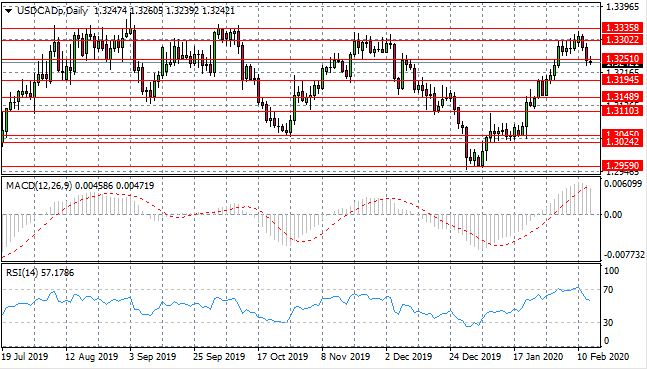
USD/CAD
The USD/CAD pair has rebounded from the 1.330 resistance area, to take price action back towards the 1.325 support level. The bearish moves have decelerated after the break with a doji candle in early trading indicating indecision. The next most likely course of action is moving towards the 1.319 support level. Momentum indicators are pulling back from strongly bullish positions.
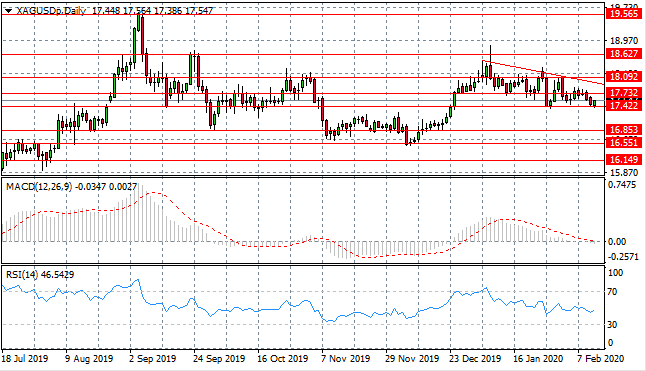
SILVER
Silver continues to test the 17.42 price floor where the metal has been unable to break on previous occasions. Buyers have already returned in early trading to take price action back towards the 17.73 resistance line. The move represents an oscillation in an otherwise downward trend. Momentum indicators have downward trajectories.
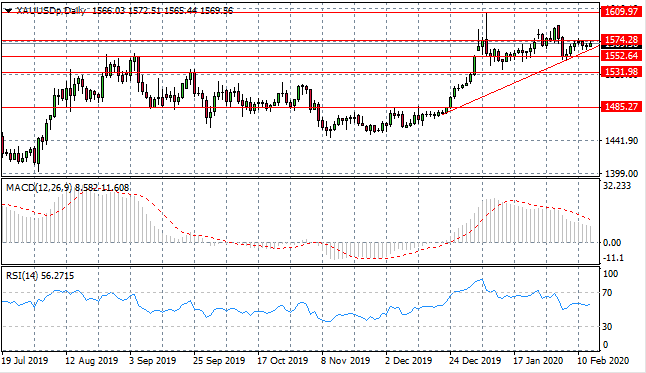
GOLD
Gold has once again rebounded from the 1552.64 price level and is now testing the 1574.28 resistance line once again. The metal has been unable to move beyond this resistance area in recent trading in the absence of major macroeconomic news. Momentum indicators have downward trajectories.
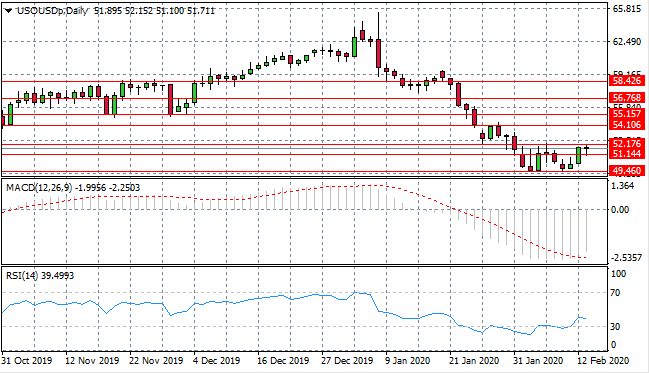
OIL
WTI is undergoing a bullish reversal with an inverted hammer candlestick indicating the end of the previous bearish trend. As such, the commodity has since broken the 51.14 resistance line and price action may stabilise around the $50 per barrel mark. Momentum indicators have bullish trajectories with RSI breaking the zero line to the upside.
Sign up to get started
LIQUIDITY
PROVIDERS