Oil Market Volatility Continues
- 19 Jul 2019
Kickstart your new year with the best USD50 bonus campaign. Limited-time offer! Get it now!
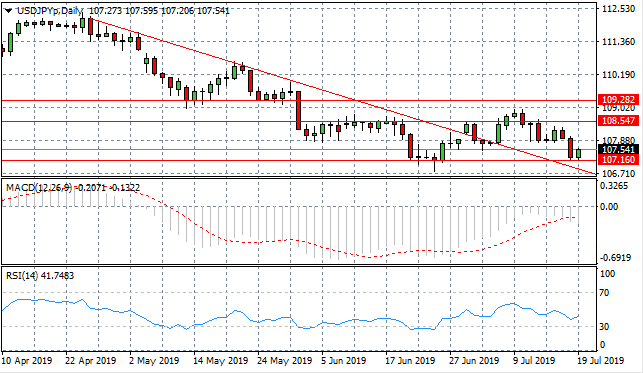
USD/JPY
The USD/JPY pair has bounced back from the 107.16 price level, as the pair appears to be entering into a trading range between the 107.16 and 108.54 price levels. The pair continues to oscillate around the descending trendline and despite a break, is returning to the trendline again. Momentum indicators are mixed with MACD remaining negative and RSI bouncing back from oversold conditions.
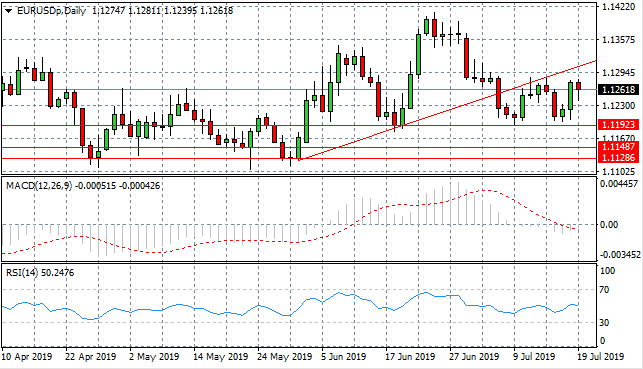
EUR/USD
EUR/USD continues to test and then rebound from the 1.119 support level. Price action is climbing back towards the ascending trendline which has become a resistance area for the pair recently. Momentum indicators are neutral with MACD testing the zero line and RSI languishing at the default line.
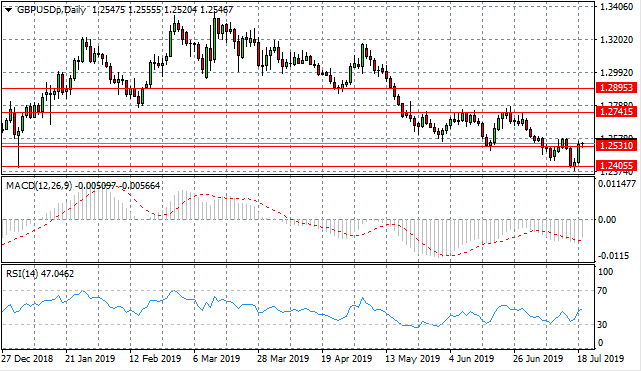
GBP/USD
The GBP/USD pair has rebounded to break the 1.253 price level to the upside which may take the pair back into the 1.253- 1.274 trading range. Momentum indicators suggest that a bullish reversal may be underway as the pair has pulled back from the 30 support level.

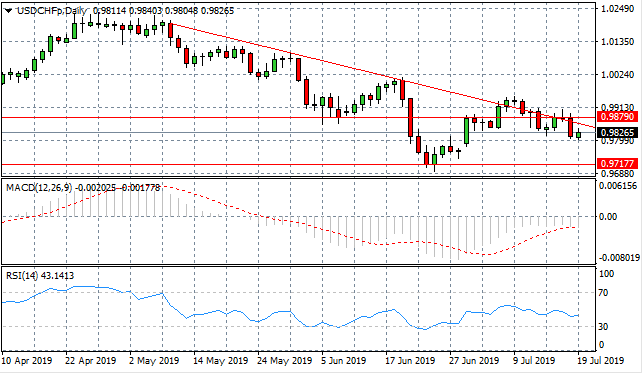
USD/CHF
The USD/CHF pair has rejected the 0.987 resistance line as well as the descending trendline, as the longer-term downtrend remains intact. The trendline will likely remain as a strong resistance area for the pair. Momentum indicators remain bearish with MACD extending below the zero line and RSI entering the bearish channel.
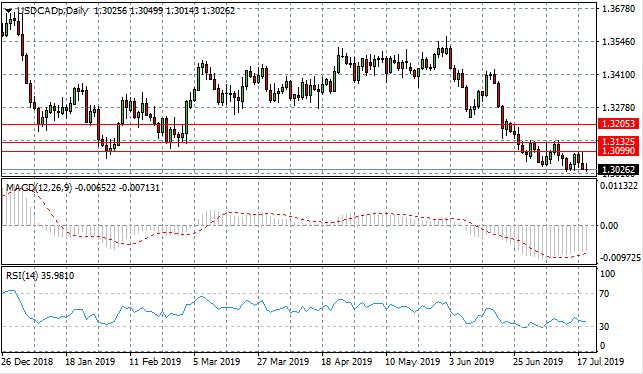
USD/CAD
The USD/CAD pair continues its horizontal trading pattern. A breakout seems imminent as oscillations move into a tighter range. Selling pressure has risen in recent trading taking the pair to oversold territory where we may see a breakout. Momentum indicators appear to undergoing moderate recoveries, turning more bullish.
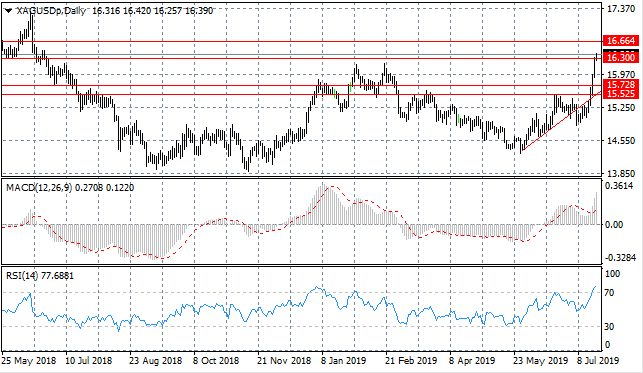
SILVER
Silver is testing a previous price high around the 16.30 price level, where on previous occasions price action has been rejected. The next target for price action will be the 16.64 resistance line. Momentum indicators support the bullish sentiment, looking extremely oversold and it seems only a matter of time before a reversal takes place.
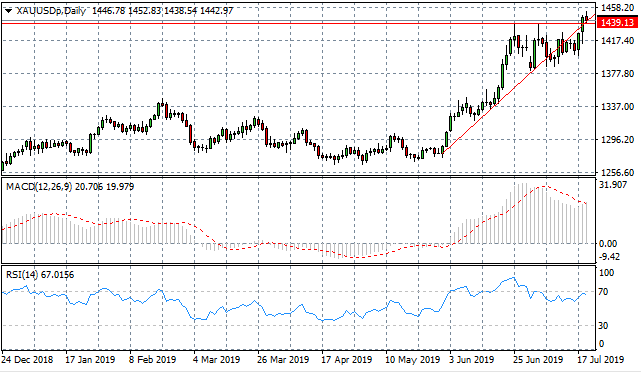
GOLD
Gold continues to test the ascending trendline and at the same time, has broken the 1439.13 resistance line. The return of sellers may suggest that this is a sticking point for the metal. Momentum indicators are also pulling back from overbought conditions in apparent bearish reversals.
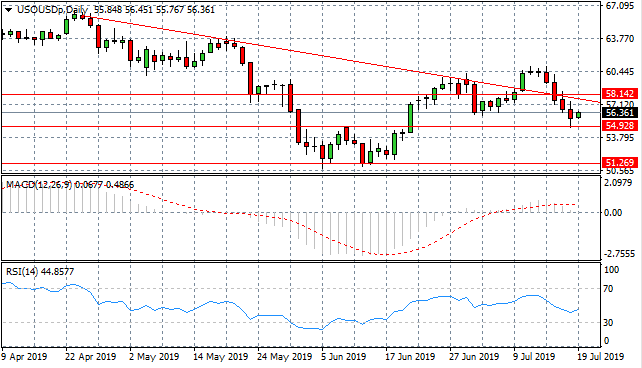
OIL
WTI has once again retraced from the $60 per barrel range and a sell-off has taken price action to break both the descending trendline and the 58.14 support level. Sellers have taken price action back to the 54.92 support level and volatility seems set to continue. Momentum indicators are moderately bullish, with MACD breaking the zero line to the upside and RSI forming an upward trajectory.
Follow Us on Facebook:
Sign up to get started
LIQUIDITY
PROVIDERS