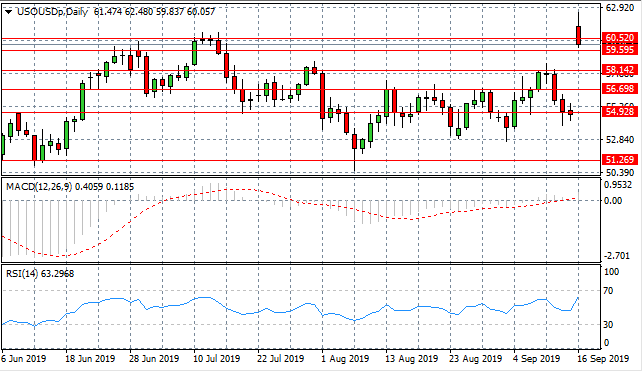
WTI Surges On Supply Fears
- 16 Sep 2019
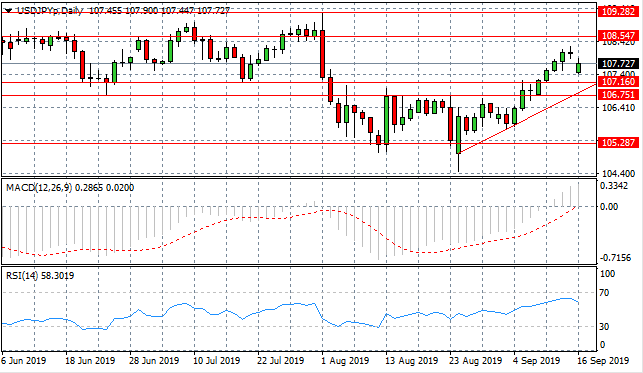
USD/JPY
The USD/JPY pair has broken the 107.16 price level, yet price action has fallen back after a doji candle appeared to signal a reversal. Buyers are still active in the pair, yet selling pressure is rising. The pair seems likely to oscillate within the 107.16 and 108.54 trading range. Momentum indicators are mixed; with MACD breaking the zero line and RSI pulling away from overbought conditions.
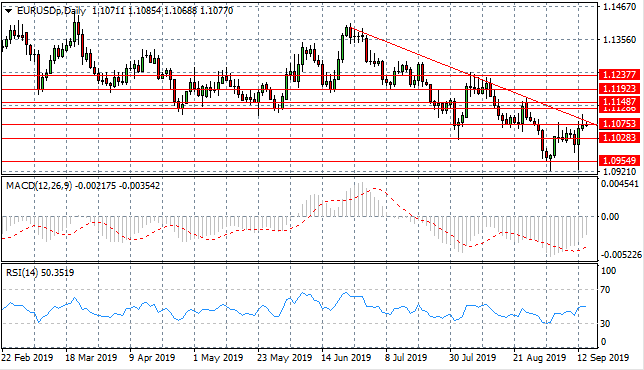
EUR/USD
The Euro is testing the descending trendline as selling pressure begins to rise significantly. The 1.107 price level is also proving to be a sticking point for the pair. Early indications suggest that the longer-term downtrend is likely to remain intact. Momentum indicators reflect the bullish sentiment, with MACD heading towards the zero line and RSI reaching the default line.
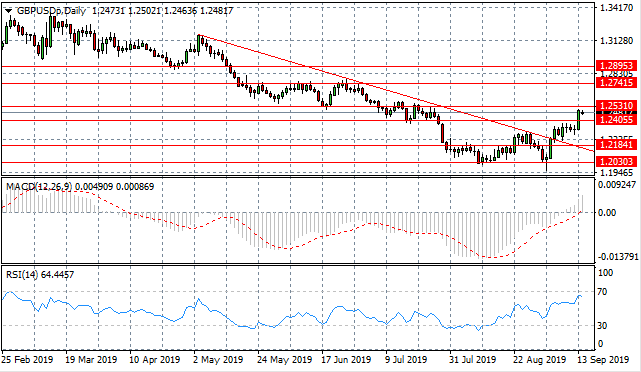
GBP/USD
The GBP/USD pair has rebounded, breaking the descending trendline and taking price action towards the 1.253 resistance level (a previous support level). Strong bullish moves suggest buyers have revived their convictions. Whether the pair can break the 1.253 resistance line remains to be seen. Momentum indicators also reflect bullish sentiment, however, RSI has reached overbought conditions which indicates a reversal may be imminent.
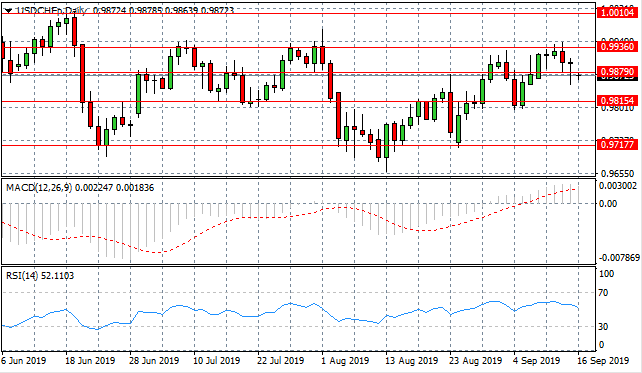
USD/CHF
The USD/CHF pair has rejected the 0.993 resistance line, as sellers return to the pair. Bearish sentiment is not completely dominant in the pair, however, as denoted by a series of Doji candles resulting in a break of the 0.987 support level. As the Doji candles, suggest buying pressure is still impacting price action. Momentum indicators suggest bullish sentiment is waning as both MACD and RSI have flattened in bearish territory.
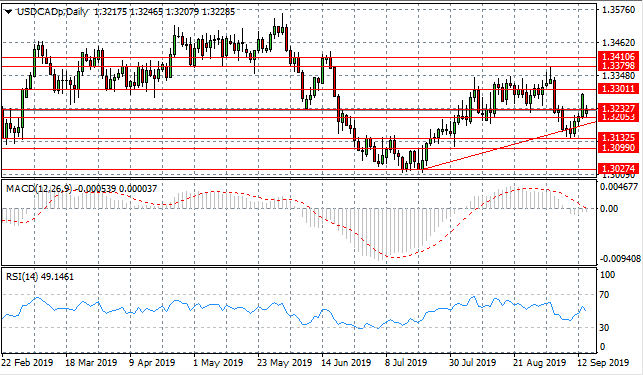
USD/CAD
The USD/CAD pair has retracted despite a break of the 1.323 support level, taking price action back as this support area becomes a sticking point for the pair. The initial bullish move seems to have lacked support. Price action may head back to the ascending trendline. Momentum indicators are neutral if slightly bearish.
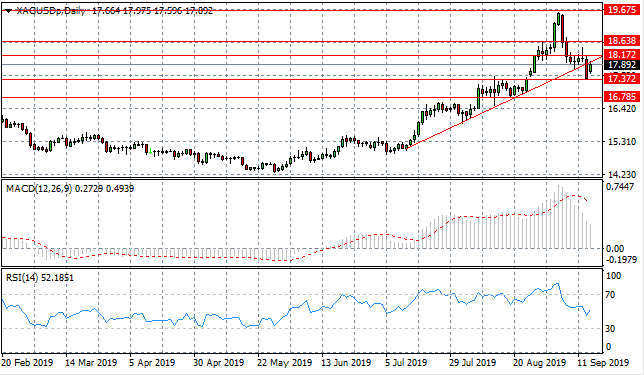
SILVER
Silver’s extended rally appears to have reversed, with the metal breaking several support levels, as well as the ascending trendline. The break of the trendline appears to have inspired buyers to return to the metal and test the support area once more. Momentum indicators are bearish with MACD heading towards the zero line and RSI forming a sharp downward trajectory.
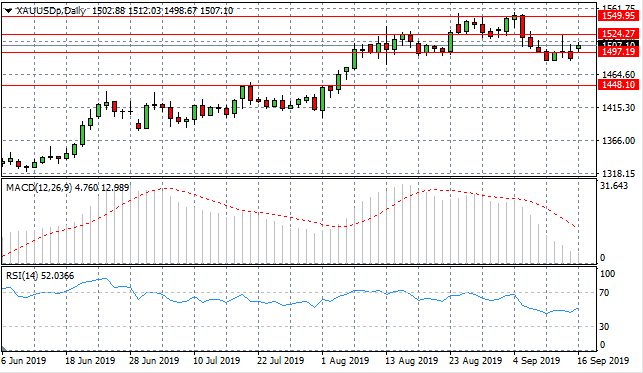
GOLD
Gold continues to test the 1497.19 support level despite strong selling pressure. A break has resulted yet buyers appear to lack conviction given the small-bodied candlestick. The next target is the 1524.27 resistance line. Momentum indicators have downward trajectories representative of residual bearish sentiment.
OIL
WTI price spiked on supply concerns related to recent geopolitical developments. Selling pressure has begun, taking price action to break the $60 per barrel mark to the downside. The next support level is at the $59 per barrel mark. Momentum indicators are mixed; with RSI forming a sharp upward trajectory, approaching overbought conditions and MACD flattening at the zero line.
Sign up to get started
LIQUIDITY
PROVIDERS