How Low Can WTI Go?
- 15 Nov 2018
USD/JPY
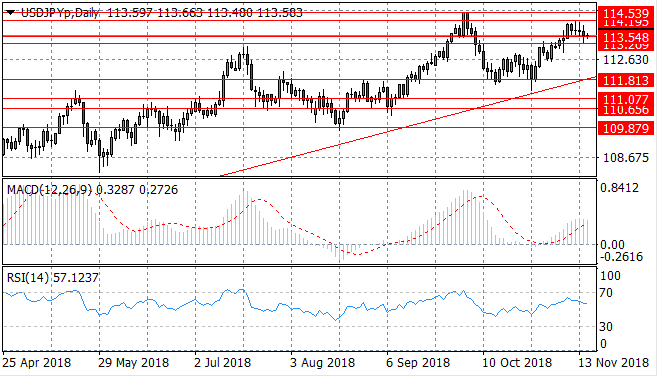
The USD/JPY pair has pulled back to test the 113.54 price level as sellers appear to have returned to the pair. The next support level lies at 113.20. Momentum indicators reflect the pullback in price action; with MACD starting a bearish reversal and RSI pulling away from overbought conditions.
Impact event: US Core Retail Sales data will be released at 13:30 GMT and will impact all US Dollar pairs.
EUR/USD
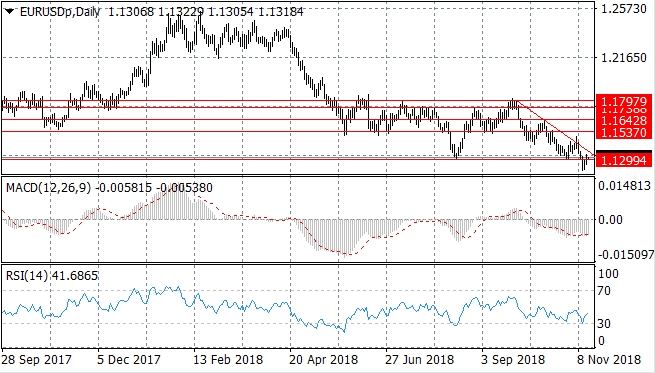
The EUR/USD pair has made a mild recovery from the sell-off early in the week, returning to test the 1.129 price level once again. Momentum appears to be turning less bearish with RSI pulling away from oversold conditions. The pullback, however, may represent a pause in a newly established downtrend. A full break of the 1.129 price level will likely see the pair rejected by the descending trendline once again.
GBP/USD
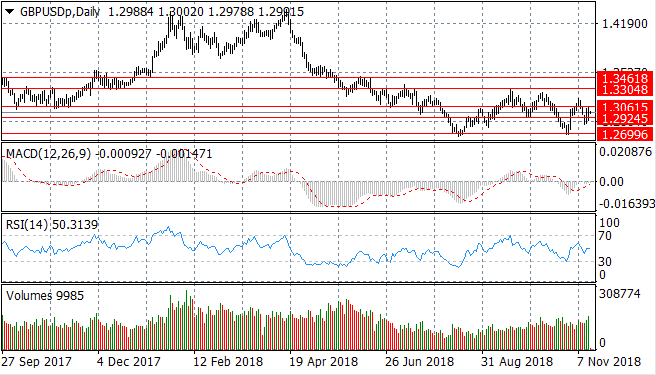
The GBP/USD pair has broken the 1.292 price level to the upside and is now testing the 1.306 price level once again. Momentum indicators are bullish; with MACD testing the zero line to the upside yet RSI has flattened at the 50 default line. The pair appears to be consolidating in a trade range between the 1.269 and 1.330 price levels and will likely move sideways between these two price levels moving forward.
Impact event: UK Retail Sales data will be released at 09:30 GMT and will impact all GBP pairs.
USD/CHF
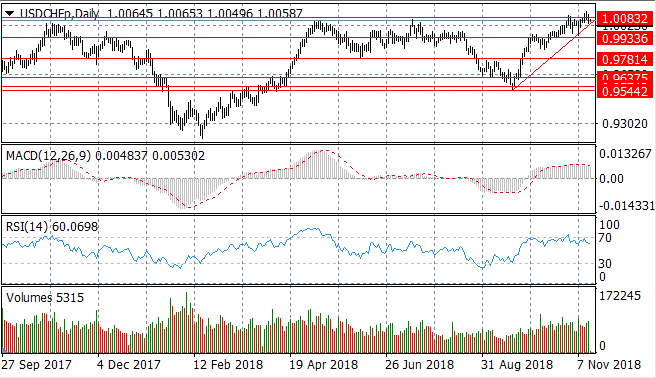
The USD/CHF pair continues to test the 1.008 price level and despite a recent break, sellers returned. The tussle may continue for some time, however buyers will likely return in the near term as price action approaches the ascending trendline. MACD has flattened in bullish territory whilst RSI continues to test the 70 resistance line.
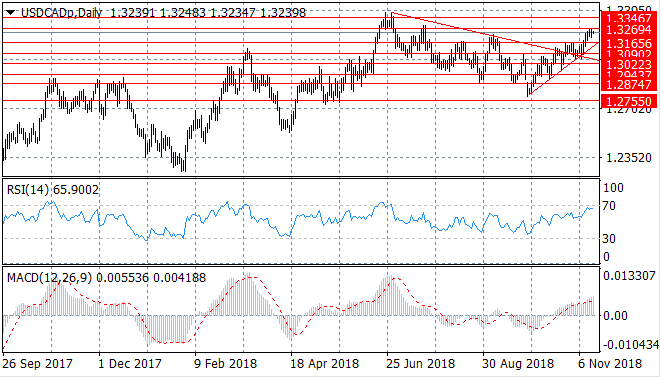
USD/CAD
The USD/CAD is approaching the 1.326 price level as a short-term ascending trend has developed. A break would prove significant and would likely take price action towards a recent price high at the 1.334 price level. Momentum indicators are mixed; RSI continues to touch the 70 overbought area and MACD has extended its bearish position, meaning fundamental factors will likely come into play when determining future price action for the pair.
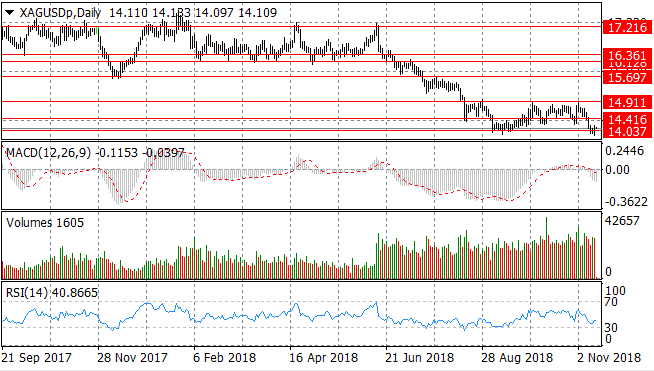
SILVER
Silver is testing the lower bound of a recent trading range at the 14.03 price level. Despite a few breaks, sellers have been unable to gain control. Momentum indicators are mixed; with MACD breaking the zero line and extending its position into bearish territory. RSI by contrast appears to be undergoing a momentum reversal.
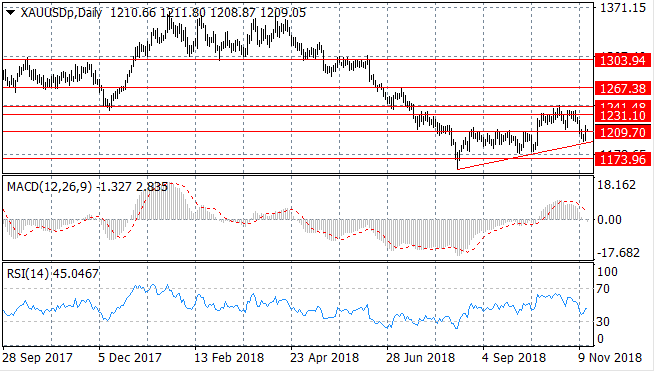
GOLD
Gold has once again undergone a bullish retracement from the ascending trendline at the 1191.58 price level and as a result, has returned to break the 1209.70 price level. Momentum indicators have slowed the bearish momentum with MACD stalling at the zero line and RSI pulling back from the 30 support level.
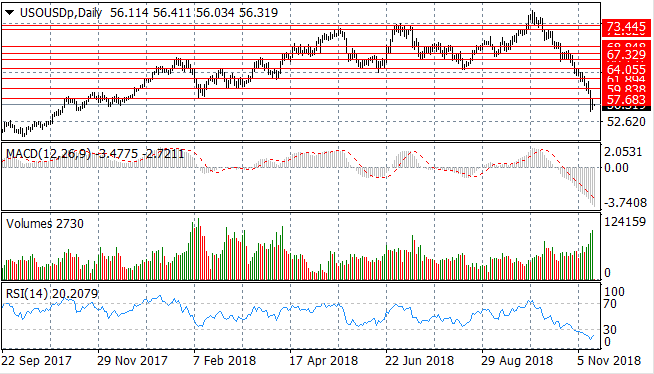
OIL
Oil price continues to break clear support levels and has pushed below the 57.68 price level. Momentum indicators support the sell-off; with MACD extending its bearish position and RSI extending into overbought conditions with a break of the 30 support level. At the same time volume is climbing indicating significant conviction from sellers.
Sign up to get started
LIQUIDITY
PROVIDERS