Pound Approaches 5-Month Price High
- 31 Oct 2019
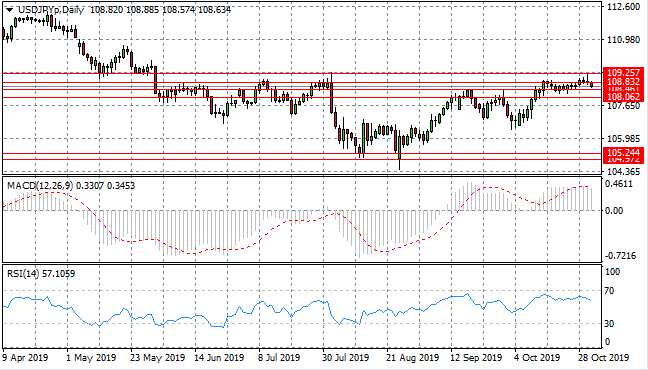
USD/JPY
The USD/JPY pair has pushed passed the 108.83 support line and is now approaching the 108.46 support line after a rise in selling pressure in the last trading session. Sellers may be started to dominate the pair. Momentum indicators are pulling back from bullish territory.
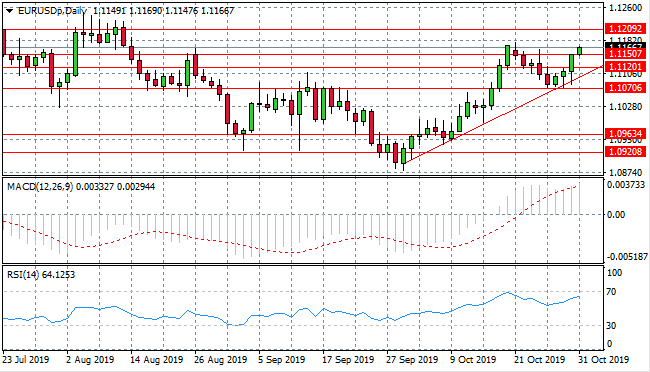
EUR/USD
The Eurodollar has rebounded from the ascending trendline, breaking the 1.115 resistance level, representing the resumption of the previous uptrend. The next target for buyers is the 1.120 price level. Momentum indicators are continuing with their bullish trajectories.
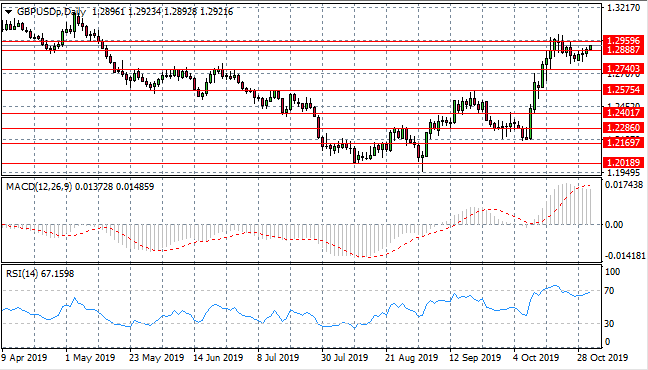
GBP/USD
The GBP/USD pair has cleared the 1.288 resistance level, with buyers returning driving price action towards the 1.295 resistance line. The move indicates a return to the previous rally. Momentum indicators remain in bullish territory with RSI continuing to test oversold conditions.
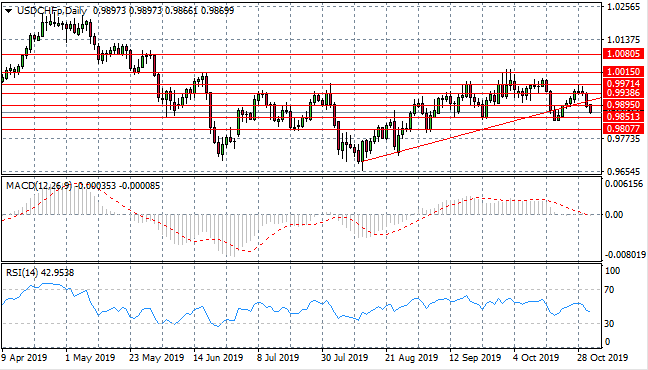
USD/CHF
The USD/CHF pair has broken both the ascending trendline and the 0.989 support level, with price action approaching the 0.985 support level. Price has rebounded at this price level on previous occasions. Momentum indicators have turned bearish with MACD testing the zero line and RSI continuing a downward trajectory.
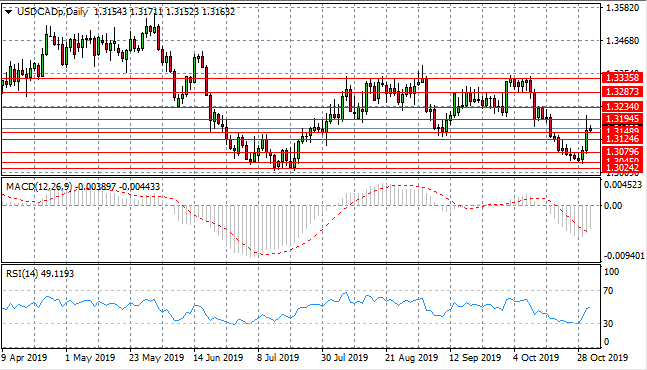
USD/CAD
The USD/CAD pair has almost completed a bullish reversal after a sell-off which began towards the end of September. The pair spiked through the 1.319 resistance level before selling pressure resulted in the pair steadying at the 1.314 support level. Momentum indicators are also undergoing bullish reversals.
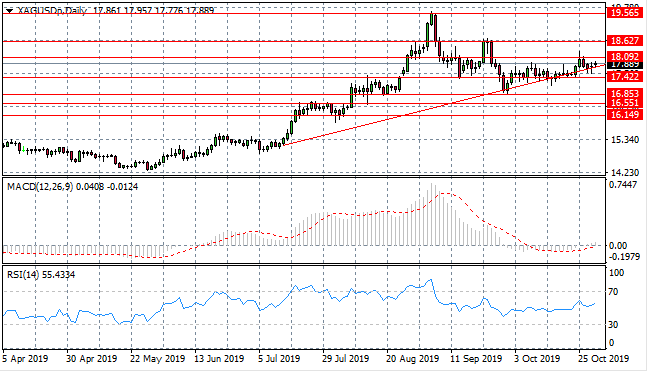
SILVER
Silver continues to test the ascending trendline and despite price spiking through the support level, a break is yet to take place. It is most likely that the pair will hug the ascending trendline as the bullish sentiment continues. The next price target is the 18.09 resistance line. Momentum indicators have begun upward trajectories moving into bullish channels.
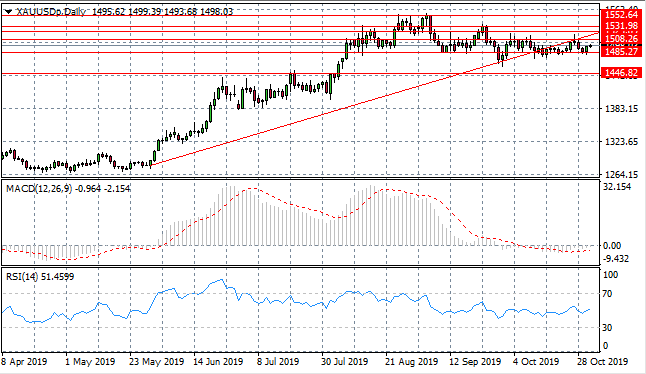
GOLD
Gold has been trading horizontally, within a tight trading range recently. Price action is oscillating between the ascending trendline and the 1485.27 price levels, after a break of the trendline. The next price target for price action is the 1508.26 resistance line- where price action has rebounded on previous occasions.
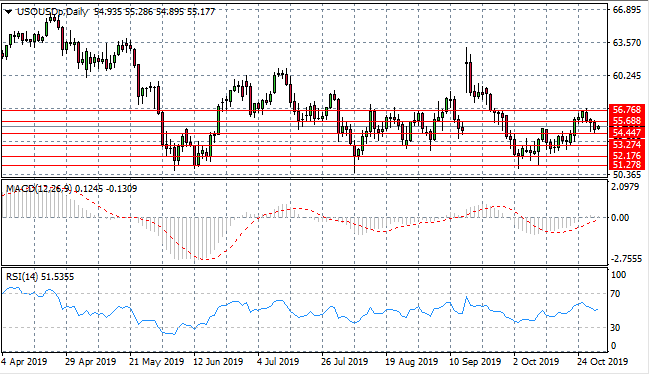
OIL
WTI has pulled back from the 56.76 resistance level, to break the 55.68 support level and despite a test of the 54.44 support level, buyers have returned to take price action to stabilize above the $54 per barrel range. Momentum indicators are mixed; with MACD breaking the zero line to the upside and RSI becoming more bearish.
Sign up to get started
LIQUIDITY
PROVIDERS