Will Bearish Sentiment Continue For The USD/CHF Pair?
- 5 Feb 2020
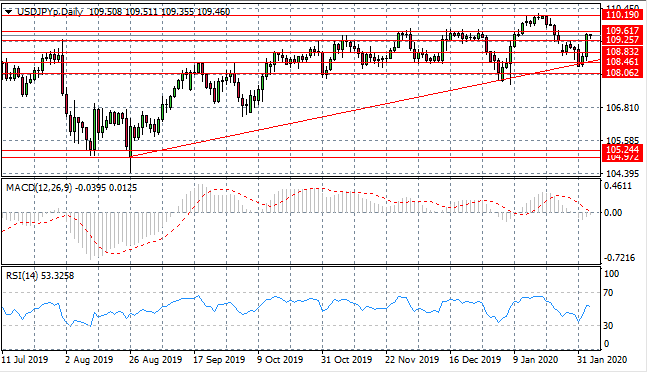
USD/JPY
The USD/JPY pair has rebounded back towards the 109.61 resistance level having broken several resistance lines, this price level denotes a key obstacle for the pair in the past, which price action was unable to move beyond. The longer-term bullish trend remains intact despite bearish pullbacks. Momentum indicators have flattened in neutral/bullish territory.
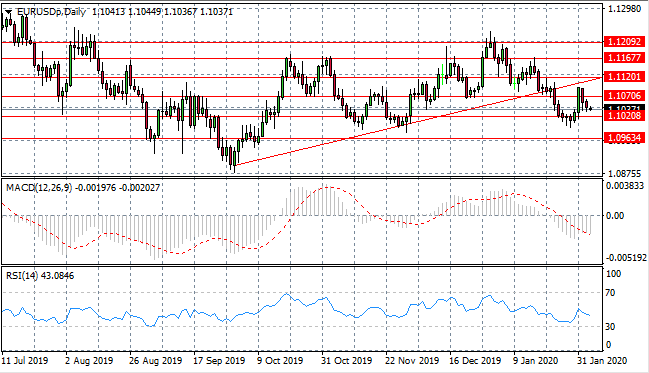
EUR/USD
The Eurodollar has reversed its position after approaching the ascending trendline; which has now established itself as a resistance area for the pair. The move has resulted in a break of the 1.107 support level, with price action heading towards the 1.102 support level. Momentum indicators have pulled back and remain in bearish territory.
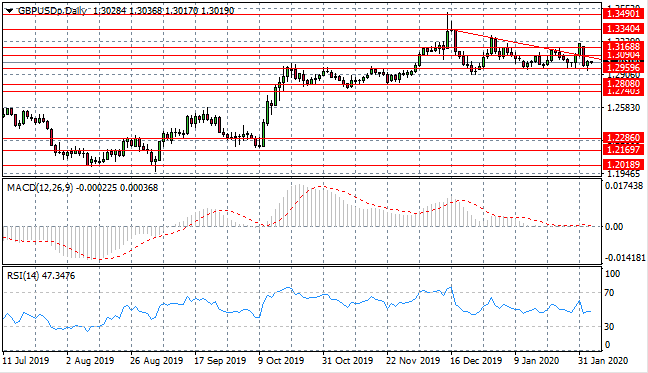
GBP/USD
The GBP/USD pair is climbing back towards the descending trendline once again where price action has previously pulled back. The 1.295 support level remains a key obstacle for sellers, with price action unable to breach the support area on several previous occasions. The pair is likely to trade in range between the 1.295 and 1.316 price levels. Momentum indicators remain in neutral territory.
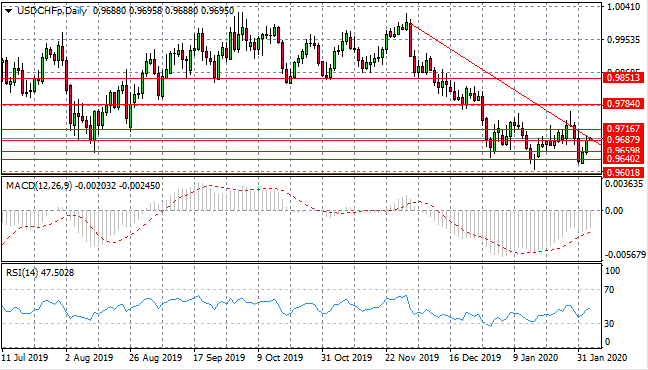
USD/CHF
The USD/CHF pair has begun another reversal and now the pair is testing the descending trendline as well as the 0.968 price level. On several previous occasions, price action has been rejected at this resistance area. Momentum reversals are also underway.
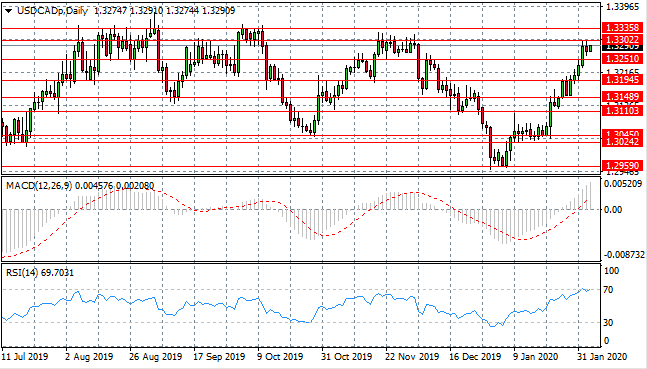
USD/CAD
USD/CAD buyers appear to be losing steam at the top of the most recent bullish move, where some selling activity has begun to rise. Once again, the pair has been unable to break the resistance area. The next likely target is the 1.325 support level as a price reversal seems likely. Momentum indicators continue to test overbought conditions.
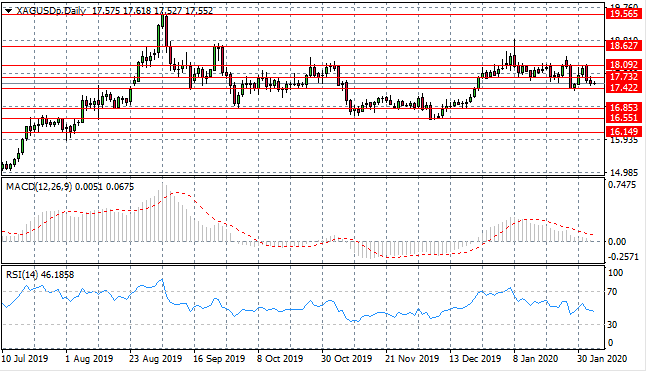
SILVER
Silver continues to languish between the 17.42 and 18.09 price levels as oscillations begin to narrow. Currently, without any major fundamentals news, the metal is trading somewhat horizontally with a moderate bearish bias. Momentum indicators have downward trajectories, with RSI entering the sell channel.
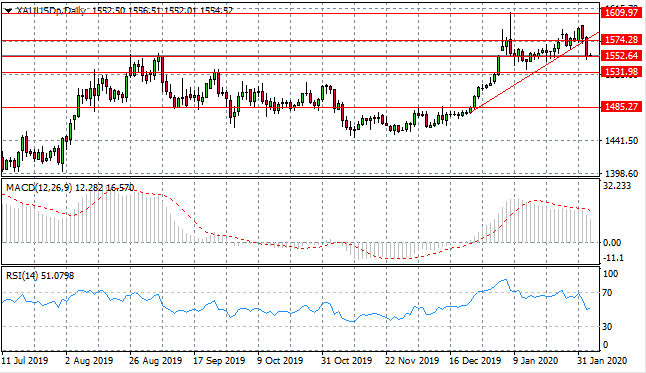
GOLD
Gold has pulled back further to the 1552.64 price level resulting in a break of the ascending trendline suggesting that sentiment has turned bearish for the metal. A break of the current support area would mean the commodity had returned to a previous trading range, effectively reversing the recent bullish move. Momentum indicators have sharp downward trajectories.
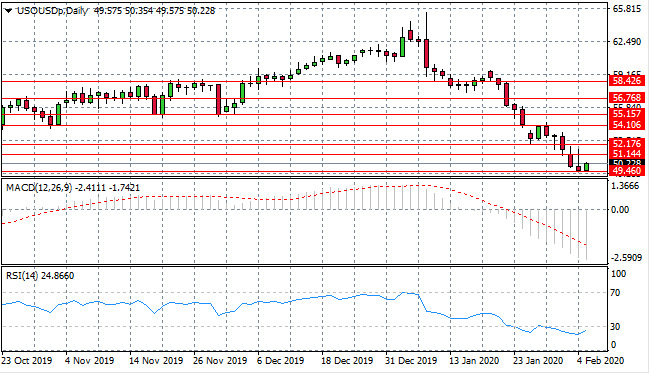
OIL
WTI may be undergoing a price reversal, as an inverted hammer candlestick in yesterday’s trading may highlight a potential bullish reversal. Buyers have since returned at the 49.46 support level, which represents a longer-term price low. Momentum indicators are in strongly bearish territory, yet RSI is pulling back towards the 30 support level.
Sign up to get started
LIQUIDITY
PROVIDERS