A Gold Price Recovery?
- 22 Feb 2021
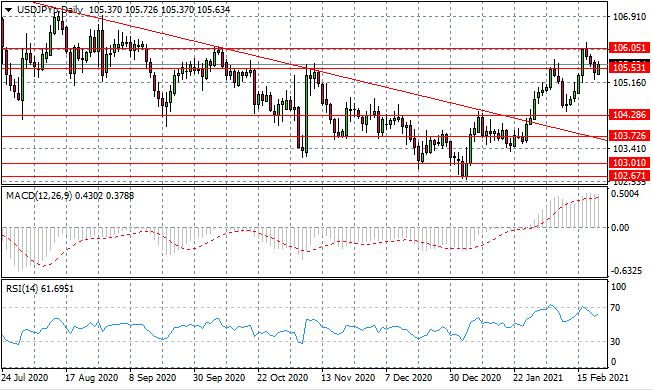
USD/JPY
The USD/JPY pair has pulled back to the 105.53 support level where the selling activity stalled and buyers returned. The pullback therefore seems to be short-lived and another attempt at the 106.05 price level seems likely. Momentum indicators remain in bullish territory with RSI pulling away from overbought conditions.
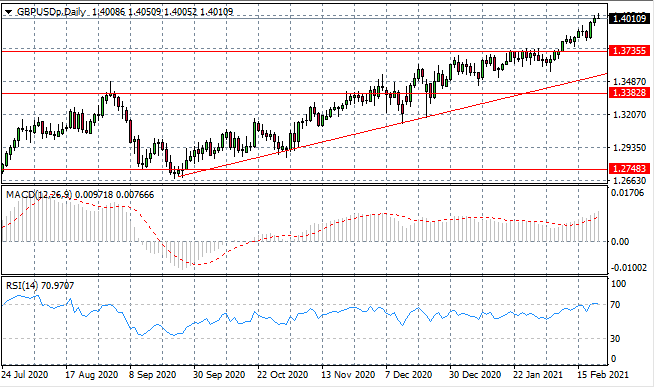
GBP/USD
The GBPUSD rally continues to move higher, reaching multi-year highs. Some slowdown in the pace of bullish momentum may be on the cards, denoted by the small-bodied candlestick in the last trading session. Momentum indicators are bullish with RSI testing overbought conditions.
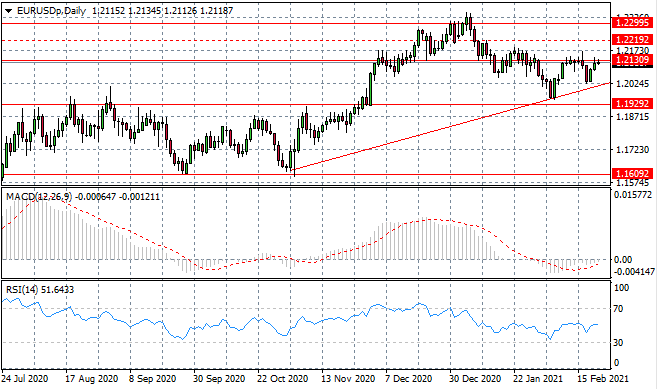
EURUSD
The Eurodollar has bounced back from the ascending trendline and is now testing the 1.213 price level once again. This price level has proven to be an obstacle in the past and another pullback may be likely given the current lack of conviction from buyers. Momentum indicators have flattened in neutral/bearish territory.
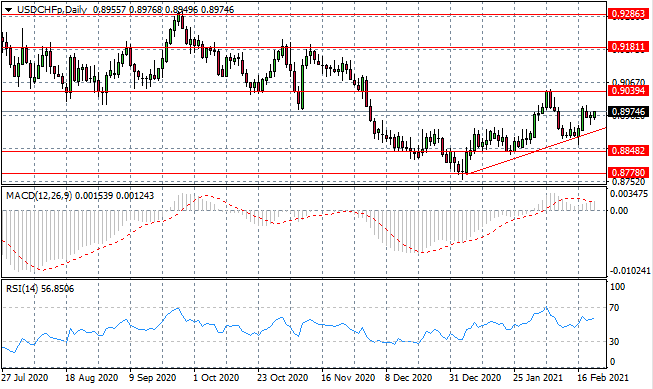
USDCHF
The USDCHF pair has bounced back from the ascending trendline and is heading towards the upper bound of an ascending triangle. The current moves may the start of a longer-term uptrend especially if the pair can break the upper bound. Momentum indicators have upward trajectories.
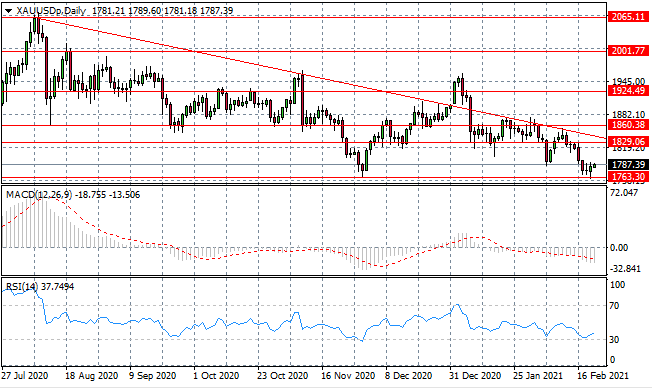
XAUUSD
XAUUSD has rebounded from a price low at the 1763.30 price level. Overall, there is a clearly established downtrend with the descending trendline acting as a resistance level. The next target is the 1829.06 resistance level. Momentum indicators are undergoing momentum reversals with RSI rebounding from the 30 support level.
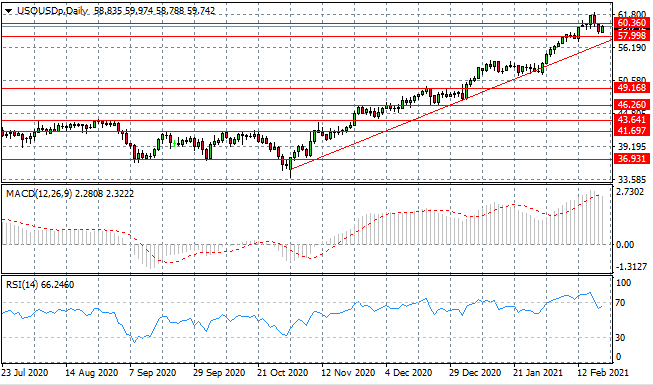
USOUSD
The USOUSD has pulled back below the $60 per barrel range, however the pullback has been moderate and may be more representative of exhaustion in the rally, rather than a trend change. A support level exists at the 57.99 price line. Momentum indicators have begun reversals, with RSI pulling back below the overbought line.
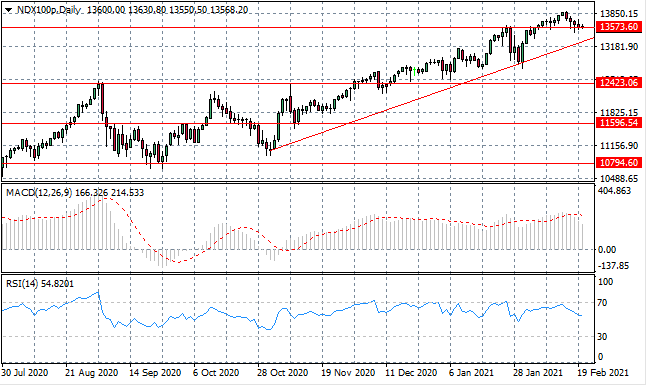
NDX100
The NDX100 has pulled back to the 13,573.60 price level which represents a previous resistance area. A sharp uptrend has been established since the end of October 2020. Previous pullbacks have only gone as far as the ascending trendline. Momentum indicators have downward trajectories.
Sign up to get started
LIQUIDITY
PROVIDERS