A Bullish Breakout For The GBP/USD Pair?
- 21 Jul 2020
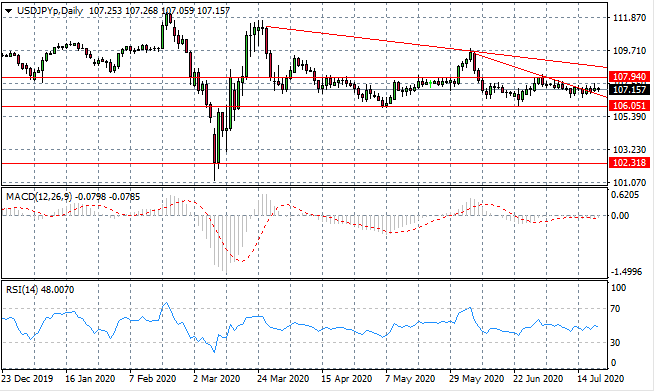
USD/JPY
The USD/JPY pair has flattened mid trading range as a break of a shorter term descending trendline has resulted in a flattening in price action. The series of small-bodied candles suggest that there is a lack of appetite to drive a trend change. Momentum indicators have flattened in neutral/bearish territory.
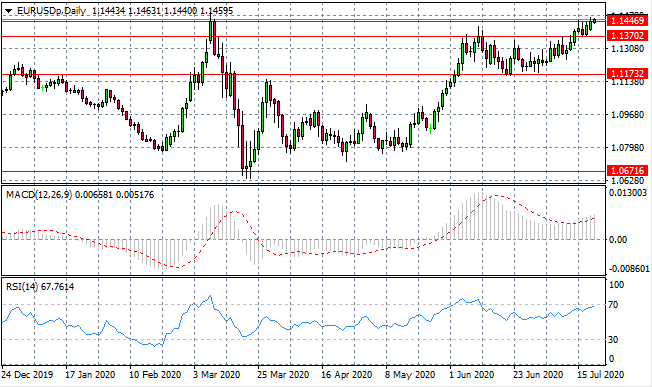
EUR/USD
The Eurodollar rally has found support once again, with the 1.144 resistance line being tested. A moderate break appears to be underway yet the question is whether buyers can sustain the break on this occasion. On previous occasions this resistance area has inspired the return of sellers and subsequently, a bearish reversal. Momentum indicators remain in bullish territory yet RSI is approaching overbought territory.
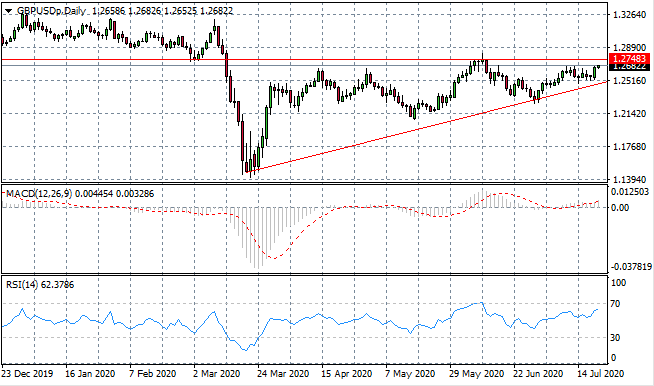
GBP/USD
A GBP/USD rally appears to be beginning with the 1.274 price target in sight. Previously, this price line has proven to be an obstacle and represents the ceiling of an ascending triangle pattern. We would expect a bullish breakout given the triangle pattern, yet it is more likely closer to the apex. Momentum indicators have sharp upward trajectories.
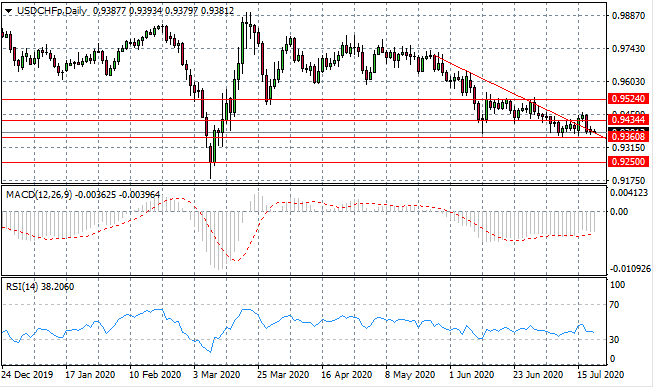
USD/CHF
The USD/CHF downtrend remains intact as sellers return to dominate price action after a brief rally. A support level exists at the 0.936 price line and a break would provide weight to the bearish move. Momentum indicators have flattened in bearish territory.
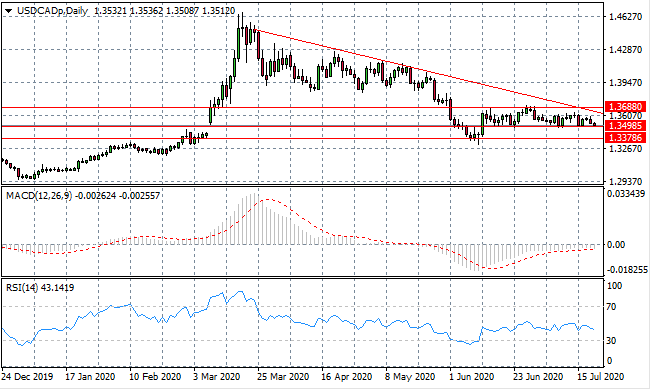
USD/CAD
The USD/CAD pair remains volatile within a tight trading range indicating a breakout may be imminent. The 1.349 price line is being tested once again. Given the history of bullish rebounds at this price line a break seems unlikely. Momentum indicators have flattened in bearish/neutral territory.
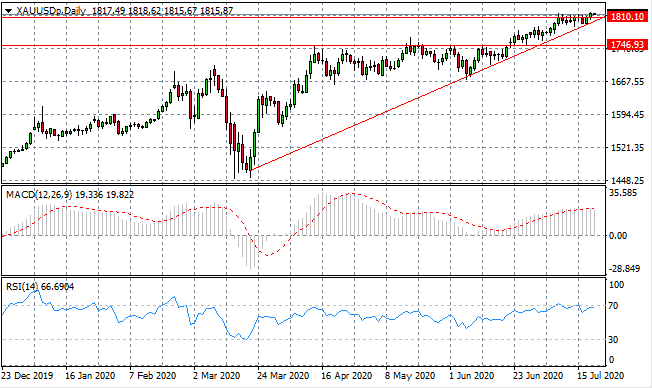
GOLD
Gold buyers have managed to break the 1810.10 resistance line yet the break is tentative. A sustained break would provide weight to the rally, however, small-bodied candles indicate a lack of conviction from buyers. Momentum indicators are strongly bullish with RSI leveling off at the overbought line.
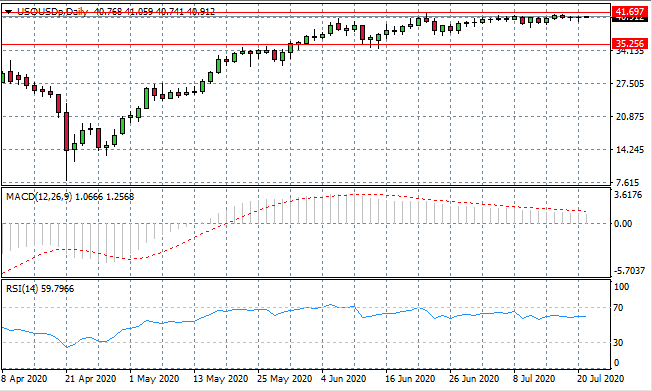
OIL
WTI has flattened just below the 41.69 resistance line which represents the gap fill line, or in other words, the marker of full price recovery to pre-Covid levels. Price action has yet to make a full recovery as there is little appetite from buyers given a backdrop of uncertainty in the economic conditions. Momentum indicators are moderately bullish.