A Bullish Rebound Imminent For WS30?
- 1 Mar 2021
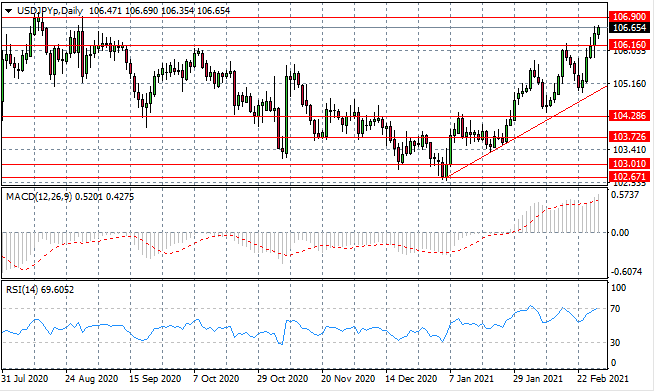
USD/JPY
The USD/JPY pair has found support and a climb in bullish momentum has taken the pair beyond the 106.05 hurdle and towards the 106.90 resistance area. This resistance level represents a price high not seen since August 2020 and highlights the beginning of a price recovery. Momentum indicators remain bullish with RSI testing the 70 overbought line.
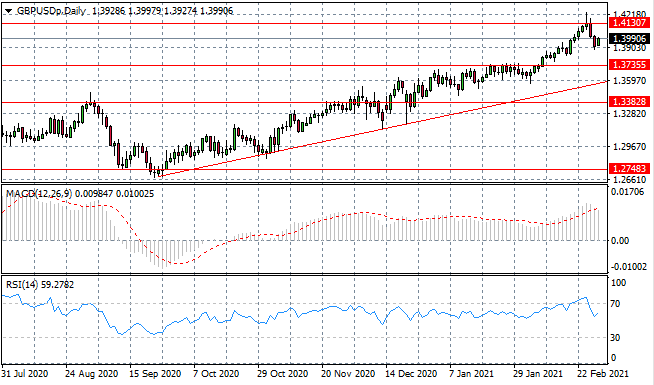
GBP/USD
The GBPUSD rally has pulled back yet buyers seem to be returning to the pair. The 1.413 resistance area remains a target for the pair as the long established rally appears to be resuming. Momentum indicators appeared to be undergoing reversals yet remain in bullish territory.
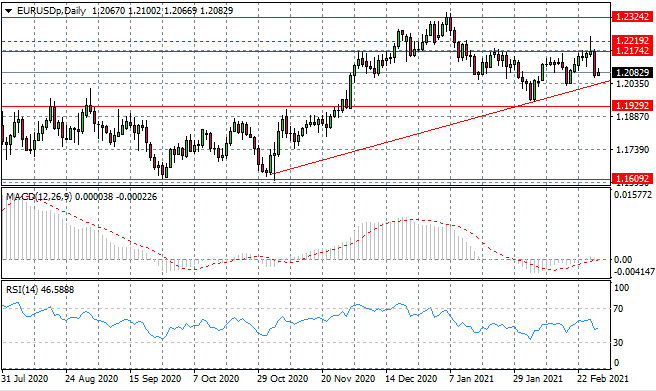
EURUSD
The Eurodollar continues to oscillate higher, as pullbacks typically only go so far as the ascending trendline. The 1.217 price line remains an obstacle for the pair and any bullish moves will require significant conviction if a break is to materialise. Momentum indicators are bullish with MACD testing the zero line.
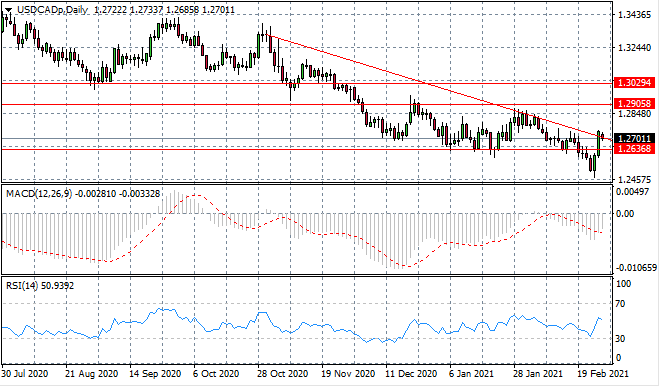
USDCAD
The USDCAD pair has tested the descending trendline, however, bearish activity has risen in early trading. A pullback seems the most likely outcome, given previous attempts have failed. Momentum indicators have sharp upwards trajectories.
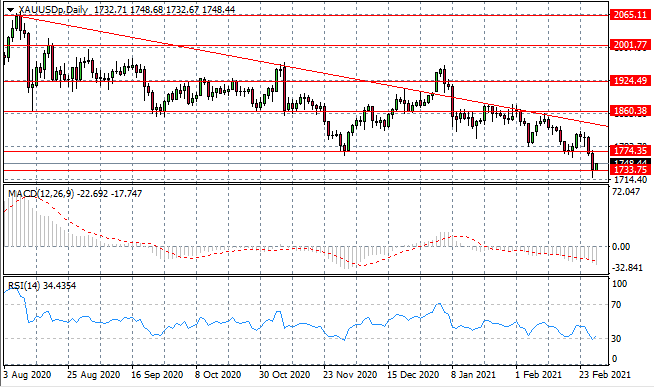
XAUUSD
XAUUSD is recovering from the 1733 support area as buyers have returned with the 1774 price line in sight. A long-term well established downtrend seems likely to remain intact for now. Momentum indicators are bearish with RSI testing the oversold line.
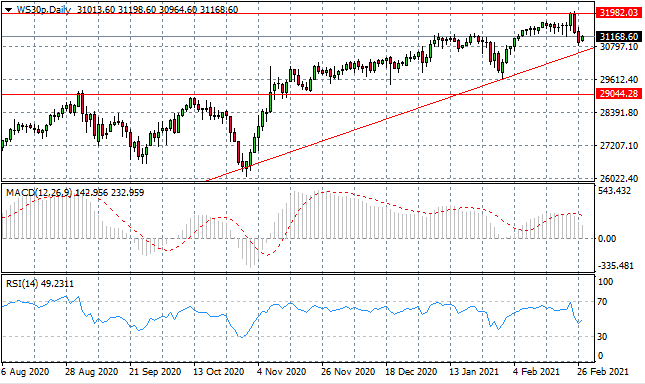
WS30
The WS30 has pulled back to the ascending trendline once again, where buyers have returned, as has been the case on two previous occasions. The next target is the 31,982 price level which represents a recent price high. Momentum indicators have downward trajectories.
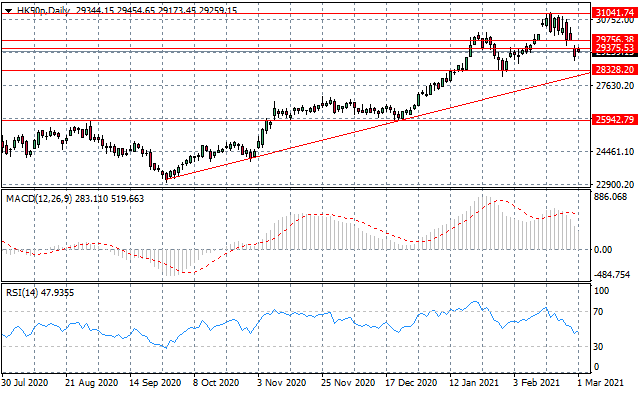
HK50
The HK50 is testing the 29,375 resistance line, yet the continuation gap in the middle of the bearish move likely indicates further downside potential for the index. A support level exists at the 28,328 price line. Momentum indicators have downward trajectories.