A Recovery Underway For EURUSD
- 1 Mar 2022
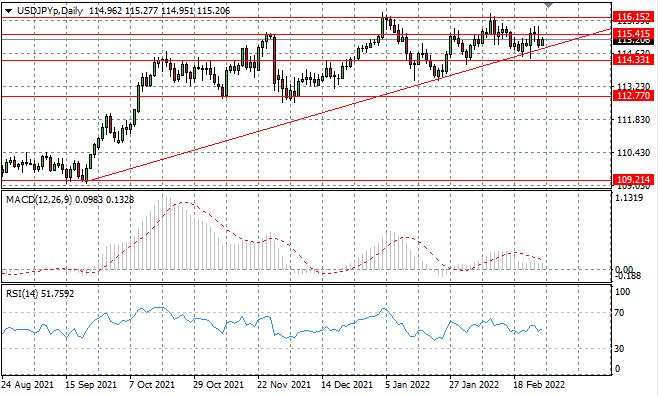
USD/JPY
USDJPY price action has encountered the ascending trendline once again, where in earlier trading, as expected, a bullish rebound appears to be underway. Price action has been contained at the 115.41 resistance line despite some major moves in recent trading, therefore bullish conviction will need to be strong to drive the break.
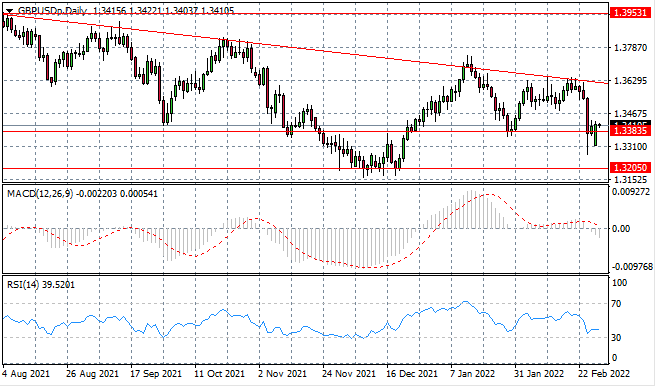
GBP/USD
The GBPUSD pair has broken the 1.338 price line, as a rally attempt will now be made and the descending trendline moves back into sight. Conviction behind the move will be tested in today’s session. Momentum indicators remain in bearish territory with MACD extending below the zero line.
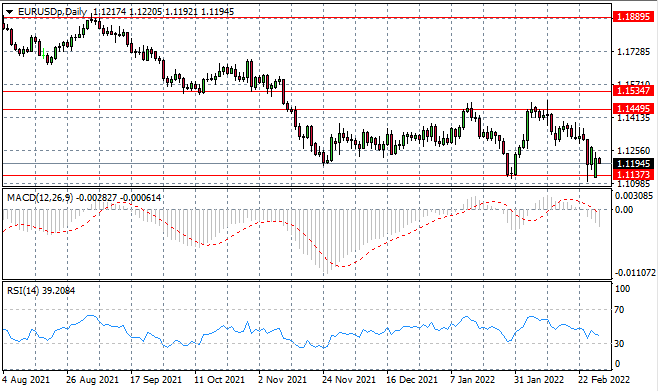
EURUSD
The EURUSD pair has rebounded from a recent low at the 1.113 support line. Bullish conviction appears to have given way to sellers at the start of the Asian session, therefore any rally attempt will be short-lived. Momentum indicators are bearish with downward trajectories.
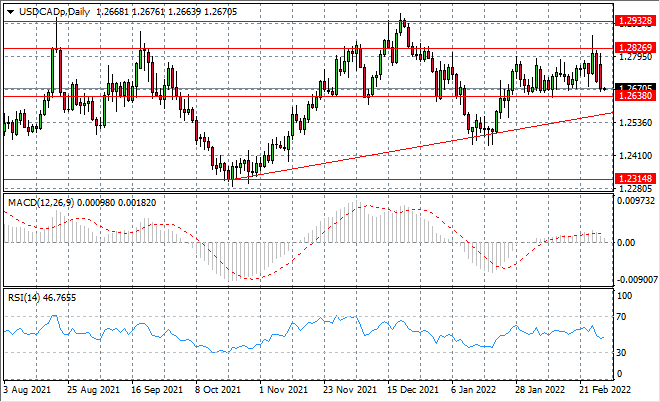
USDCAD
The USDCAD pair is making its way back to the 1.263 support line as huge selling activity has taken place in the last couple of days of trading. The lower bound of the range has held despite repeated attempts to break this consolidation range. Momentum indicators are bearish with MACD testing the zero line.
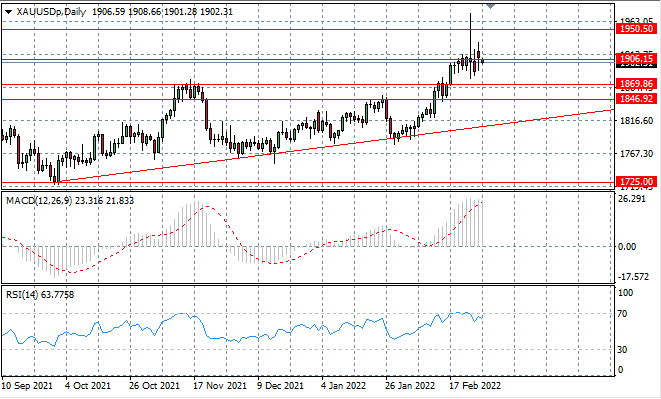
XAUUSD
XAUUSD has begun to fall back as there appears little appetite from buyers and risk sentiment becomes more subdued. A break below the 1906 support line is significant as it represents previous resistance zone. Momentum indicators have flattened in the overbought zone and reversal may be on the cards.
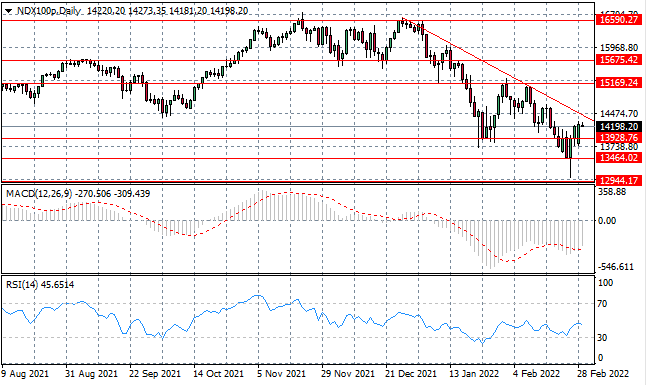
NDX100
The NDX100 has made a recovery with buyers driving a break of the 13,928 resistance line. Price action is fast approaching the descending trendline, where on several previous occasions, price action has rejected the resistance area. Momentum indicators have upward trajectories.
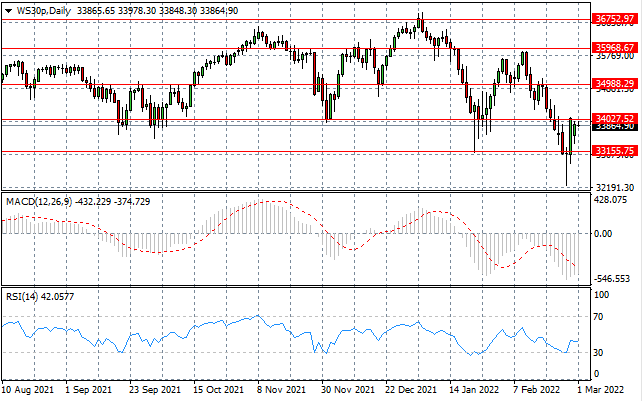
WS30
The WS30 will make another bid at the 34,027 resistance line after being pushed back in a previous attempt. The resistance line represents a previous key support level and an obstacle for sellers. In the longer-term, a bearish bias persists. Momentum indicators are undergoing reversals.