A Trend Reversal On The Cards For USD/CAD?
- 2 Aug 2021
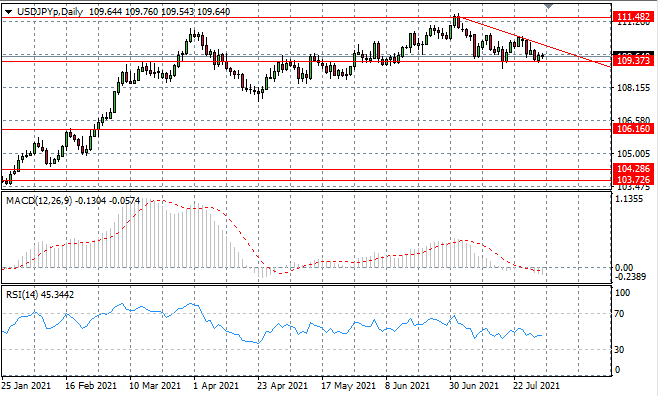
USD/JPY
The USDJPY pair continues to rebound from the 109.73 support level as buyers typically return at this price line. However, rallies have recently been contained by the descending trendline which signals that a downtrend is forming with lower highs in the rebounds. Momentum indicators have flattened in neutral/bearish territory.
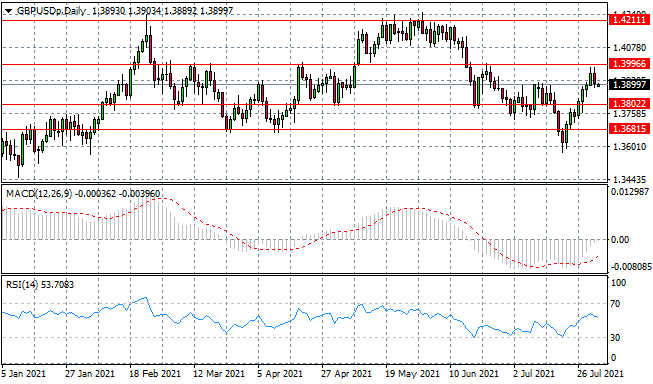
GBP/USD
The GBPUSD pair has failed to truly test the 1.399 resistance line and as such, price action has turned bearish with a a trajectory towards the 1.380 support level. The current trading range represents a consolidation zone for the pair. Momentum indicators have moderate upward trajectories.
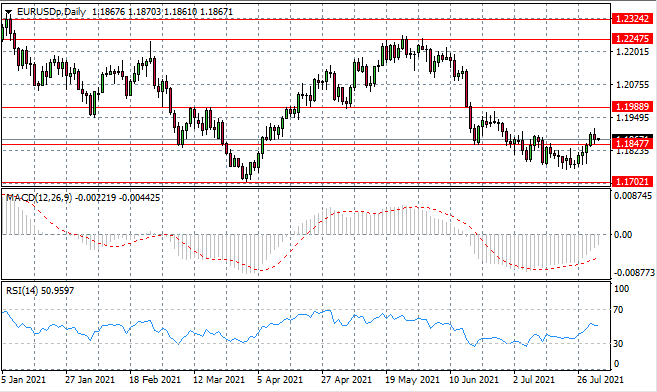
EURUSD
The Eurodollar has broken the 1.184 resistance area, yet price action has stalled. A key resistance line exists at the 1.198 price level, yet it remains to be seen whether there is enough bullish conviction to make the challenge. Momentum indicators have upward trajectories.
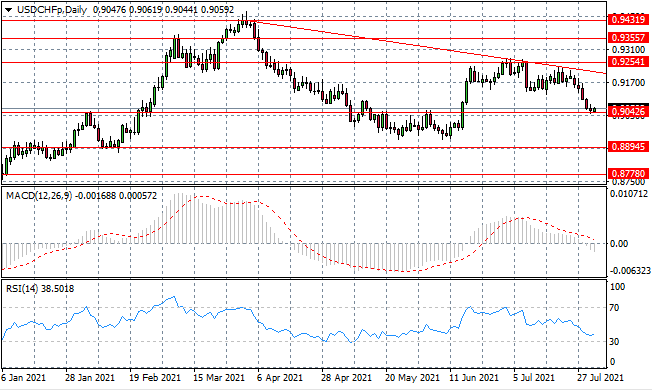
USD/CHF
The USD/CHF is floating back towards the 0.904 as bearish sentiment dominates price action. A break would send the pair to recent lows and undo the recent bullish recovery. Longer-term, sentiment appears to have a bearish bias. Momentum indicators are bearish.
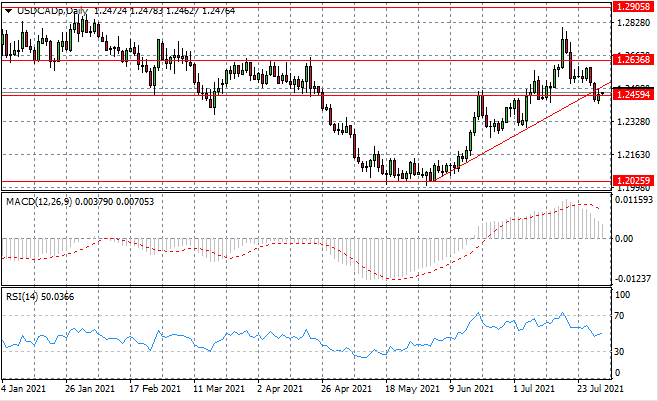
USDCAD
The USDCAD broke the ascending trendline in the first sign of a potential downtrend. A sharp rebound at the 1.245 price line suggests that buyers are still active in the pair. The trendline may now act as a resistance zone going forward. Momentum indicators have downward trajectories.
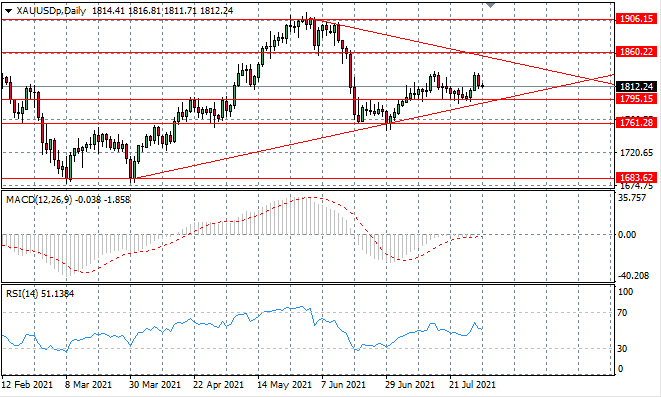
XAUUSD
XAUUSD continues to oscillate within a symmetrical triangle pattern. Oscillations had narrowed with a test of the 1795 support area, yet the test inspired the return of buyers. Oscillations are expected to narrow further as the metal approaches the apex of the triangle. Momentum indicators are neutral/bullish.
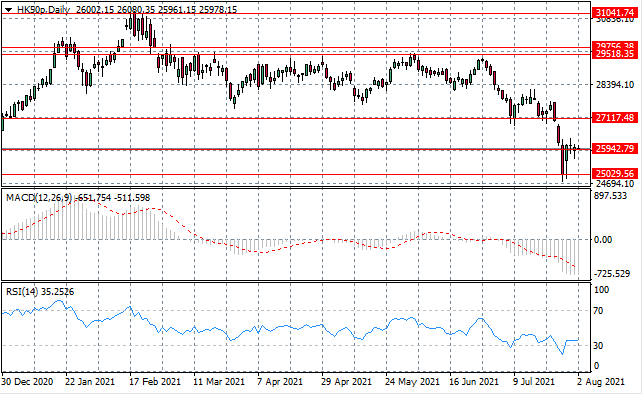
HK50
The HK50 has rebounded from a new low at the 25,029 support level. Strong bullish sentiment to drive the rally and test the 25,942 price line has since stalled. Doji candles represent indecision and waning appetite from buyers. Momentum indicators have flattened in bearish territory.