ASX200 On The Verge Of A Bullish Breakout?
- 18 Nov 2021
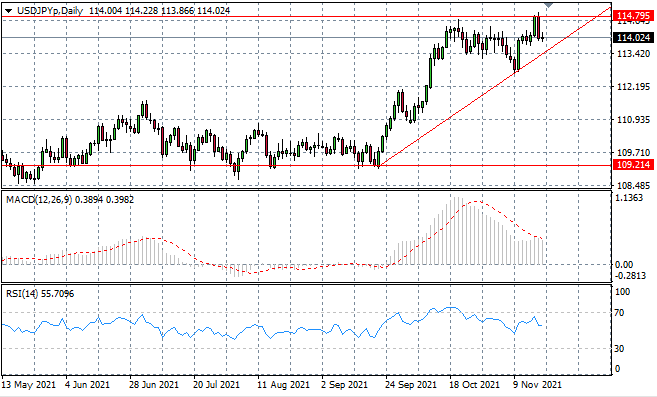
USD/JPY
USDJPY sellers have returned once again as the pair fails to generate any long-lasting momentum in recent moves. The 114.79 resistance line will represent a new price ceiling and price action will continue to oscillate with the ascending trendline forming a support level.
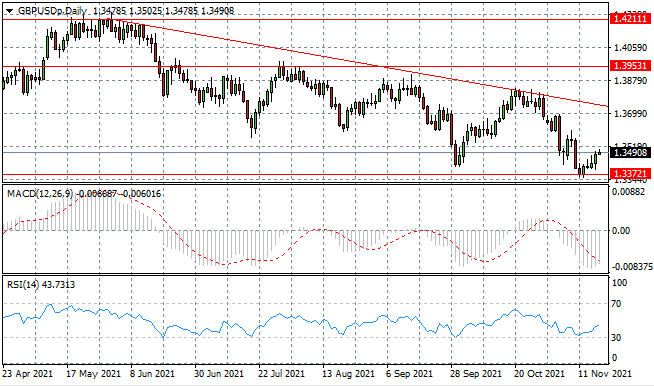
GBP/USD
The GBPUSD pair is beginning to build a rally after stalling at the 1.337 support level. Longer-term, sentiment is bearish and rallies typically only reach as far as the descending trendline. Momentum indicators are also undergoing bullish reversals and have clear upward trajectories.
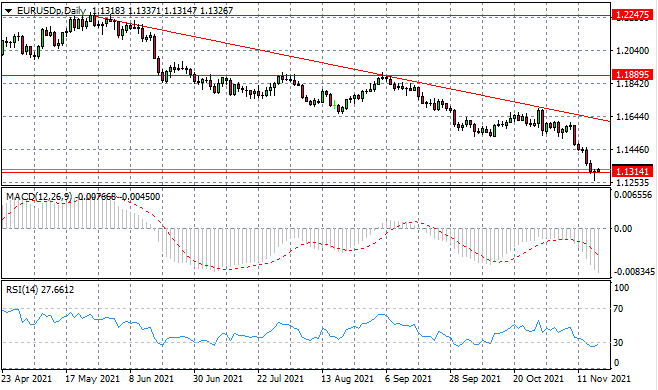
EURUSD
The EURUSD has stalled at the 1.131 support level, as a doji candle at the bottom of the move indicates the first sign of a bullish reversal. Current conviction remains low as sellers have dominated 4 of the last 6 trading sessions. Momentum indicators remain in bearish territory though RSI is turning back towards the 30 support level.
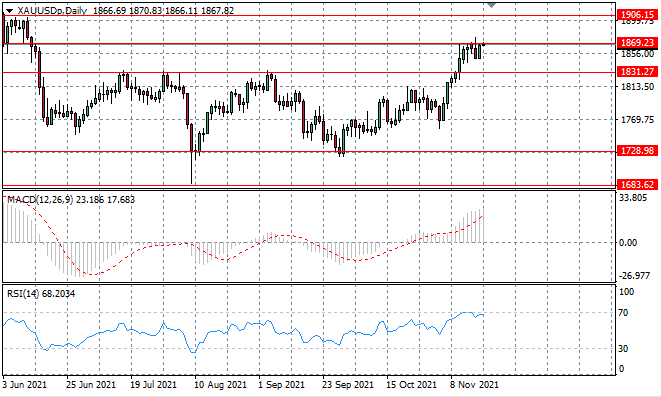
XAUUSD
The XAUUSD rally has broken down as selling activity rose at the 1869 price line. Buyers are still active yet the last few tests have not resulted in a break. However, given the lack of bearish conviction, we may see price action float along this resistance zone in the near-term. Momentum indicators highlight that the metal is overbought.
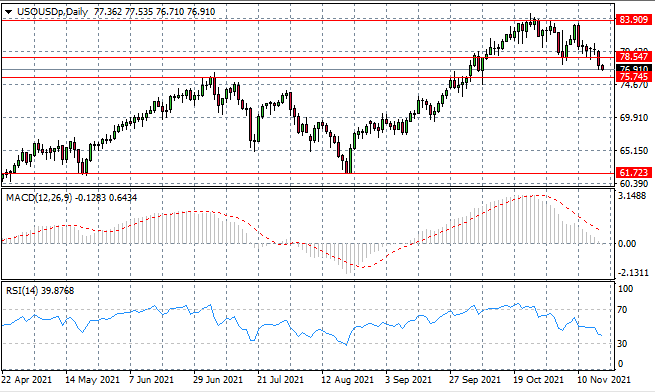
USOUSD
The USOUSD has broken a previous support level at the 78.54 price line and is fast approaching a previous resistance area at the 75.74 price line. The commodity may now move towards a more stabilized but elevated price level at the mid-$70 per barrel range. Momentum indicators have downward trajectories.
HK50
The HK50 index has once again rejected the descending trendline, as price action has begun to pullback once again in confirmation of the longer-term bearish bias. Significant bullish momentum will be required to drive a trend change. Momentum indicators have flattened in neutral territory.

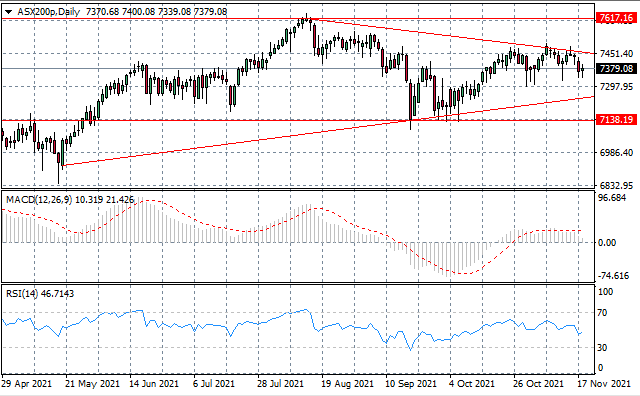
ASX200
The ASX200 index is moving closer to the apex of a symmetrical triangle, where the pattern of price action suggests a breakout will be bullish. Several tests of the upper bound of the triangle have failed to produce a break and price action continues to narrow in a tighter range.