Bullish Reversal For USD/CAD Pair?
- 30 Oct 2019
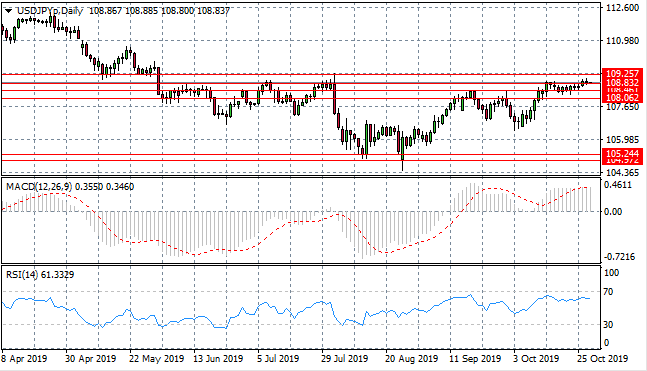
USD/JPY
The USD/JPY pair has moved beyond the 108.83 resistance line which may take price action towards the 109.25 resistance level. There currently appears to be a lack of conviction from buyers denoted by a series of small-bodied candles. Momentum indicators have flattened in bullish territory.
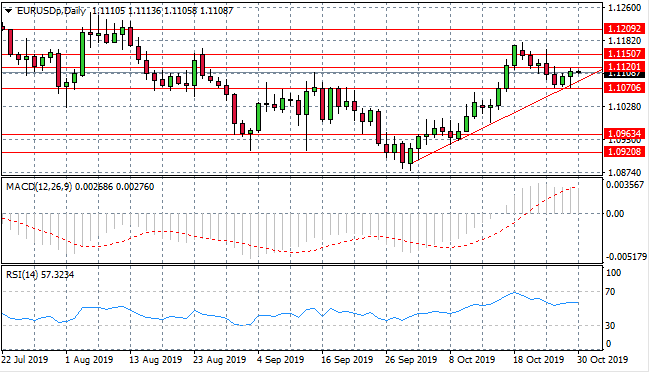
EUR/USD
The Eurodollar has rebounded from both the ascending trendline and the 1.107 support level representing the resumption of the previous uptrend. The next target for buyers is the 1.112 price level. Momentum indicators remain in bullish territory although are beginning downward trajectories.
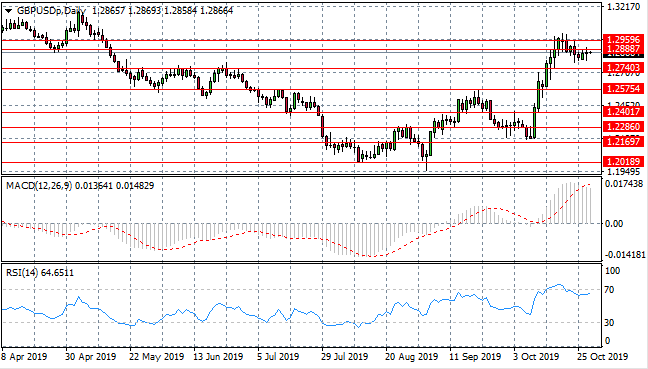
GBP/USD
The GBP/USD pair has stalled at the 1.288 resistance level as a doji candle in yesterday’s trading represents indecision in the pair. The current direction of price action may represent a pullback in the uptrend. Momentum indicators are pulling back from bullish territory.
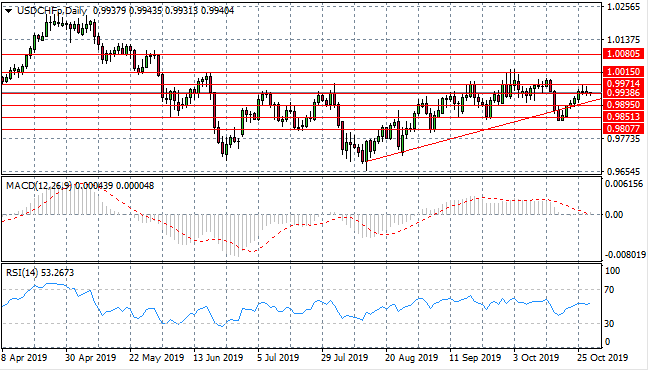
USD/CHF
The USD/CHF pair has stalled at the 0.993 resistance level having broken the ascending trendline to the upside. Selling pressure has risen indicating that the next direction for the pair is bearish. Momentum indicators are neutral if slightly bullish.
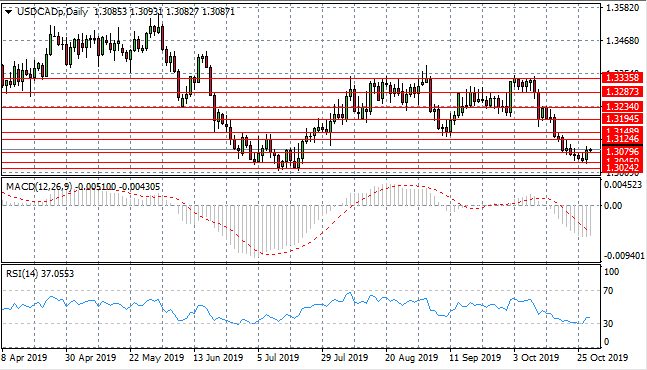
USD/CAD
The USD/CAD pair appears to be undergoing a reversal after an extended sell-off. A break of the 1.307 resistance level confirms a change in sentiment. The next price target is the 1.312 resistance level. Momentum indicators are also pulling away from oversold conditions.
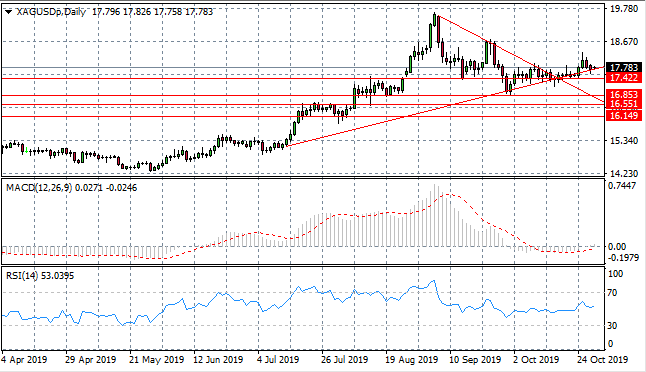
SILVER
Silver continues to test the ascending trendline and despite selling pressure, the metal has not broken the support level. Repeated tests and an increase in selling pressure raises the likelihood of a bearish trend. A break is required for confirmation. Momentum indicators are moderately bullish with MACD testing the zero line and RSI moving into the buying channel.
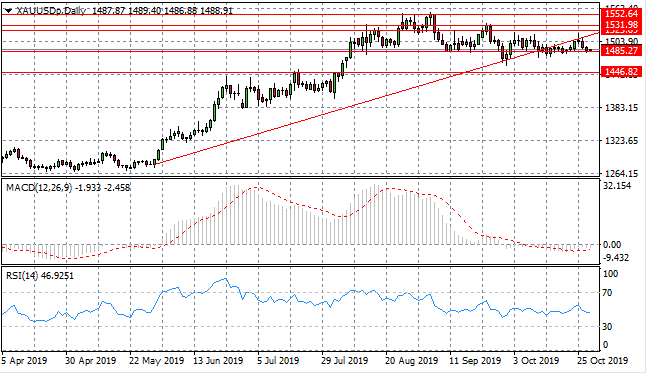
GOLD
Gold has been trading horizontally, within a tight trading range recently. Despite a test, the metal has been unable to fully break the ascending trendline to the upside. A pullback has take price action back to the 1485.27 which represents a strong support level. Momentum indicators have turned bearish.
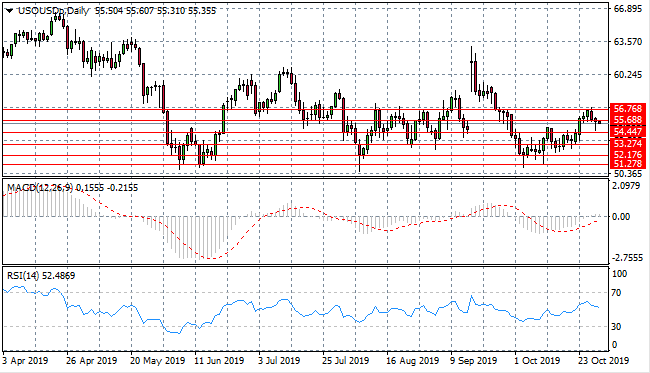
OIL
WTI has pulled back from the 56.76 resistance level as price action may stabilize at the $55 per barrel price range. Despite a break of the 55.68 support level, buying pressure took price action back towards the $56 range. Momentum indicators have divergent trajectories; with MACD breaking the zero line to the upside and RSI becoming more bearish.