Bullish Reversal Underway For Eurodollar?
- 1 Apr 2019
Kickstart your new year with the best USD50 bonus campaign. Limited-time offer! Get it now!
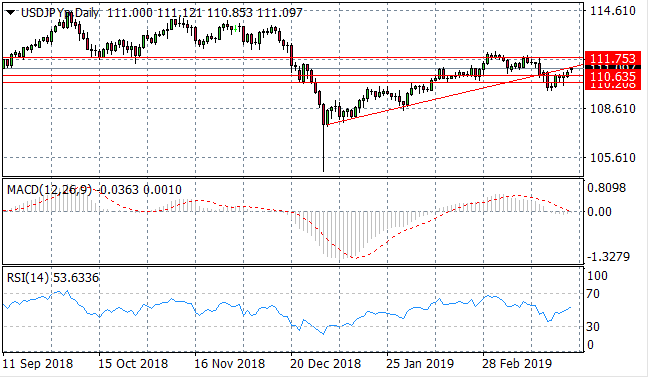
USD/JPY
The USD/JPY pair is testing the ascending trendline which represents a key resistance area for the pair and a break would send price action towards the 111.75 price level. Momentum indicators are mixed; with MACD testing the zero line and RSI beginning a momentum reversal.
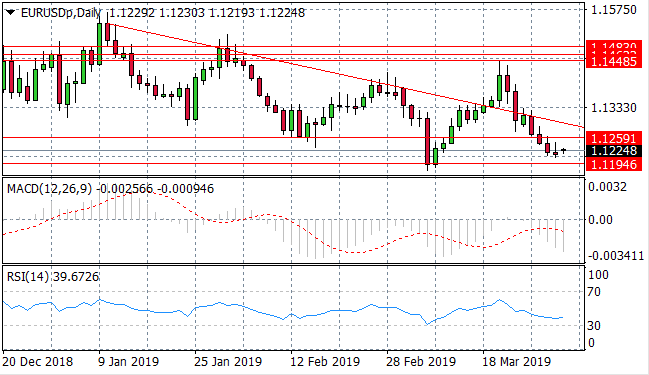
EUR/USD
The EUR/USD pair has broken the 1.125 price level and has stalled before reaching the 1.119 price level. A doji candle at the bottom of the downtrend could represent the start of a bullish reversal. Momentum indicators remain bearish with MACD breaking the zero line and RSI flattening along the 30 support level.
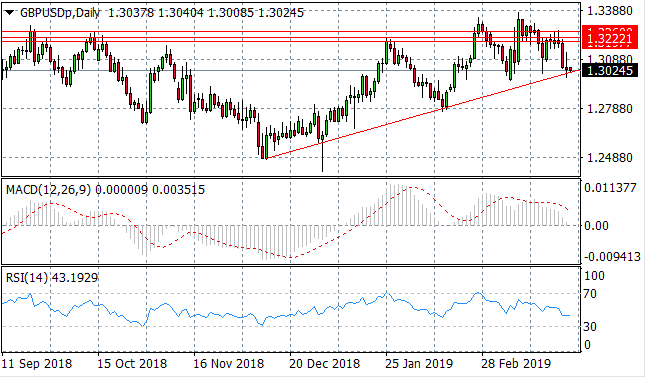
GBP/USD
The GBP/USD pair has pulled back towards the ascending trendline, as buyers and sellers seem to be tussling it out as long upper and lower shadows represent significant price volatility. The ascending trendline represents a strong support area which on previous occasions has resulted in a bullish reversal. Momentum indicators have turned more bearish.

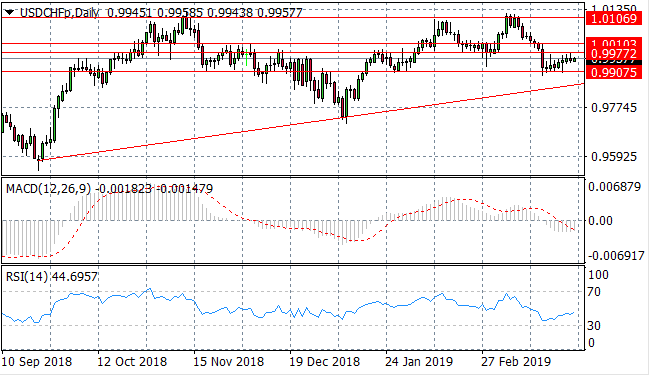
USD/CHF
The USD/CHF pair has broken a series of support levels, as the dollar suffered against the Swiss Franc. A dollar recovery has resulted in the pair heading towards the 0.997 price level and despite several tests, the pair has been unable to break the price level. Momentum indicators are undergoing bullish reversals.
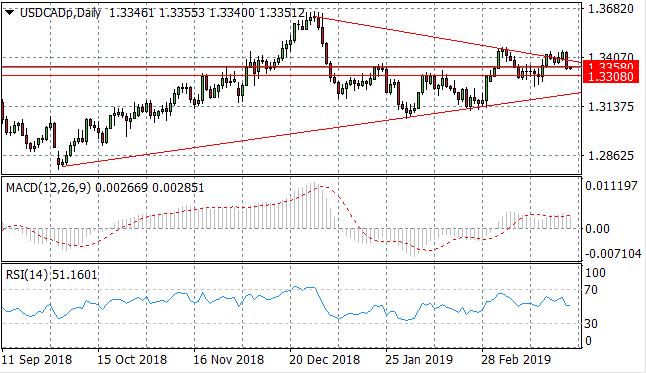
USD/CAD
The USD/CAD pair has broken the upper trendline of a symmetrical triangle after breaking the 1.335 price level. As a result, sellers have returned in emphatic style taking price action back to the 1.335 price level. Momentum indicators are neutral but slightly bullish.
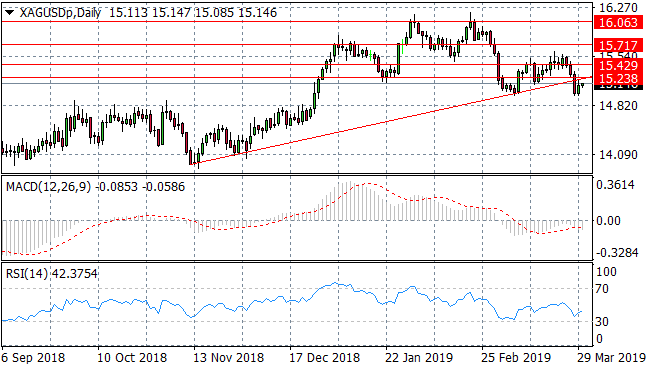
SILVER
Silver has broken both the 15.42 and 15.23 price levels as well as the ascending trendline indicating significant bearish sentiment in the pair. This also represents a break out of the trading range between the 15.23 and the 15.71 price levels. Momentum indicators are mixed with MACD extending its bearish position and RSI turning more positive.
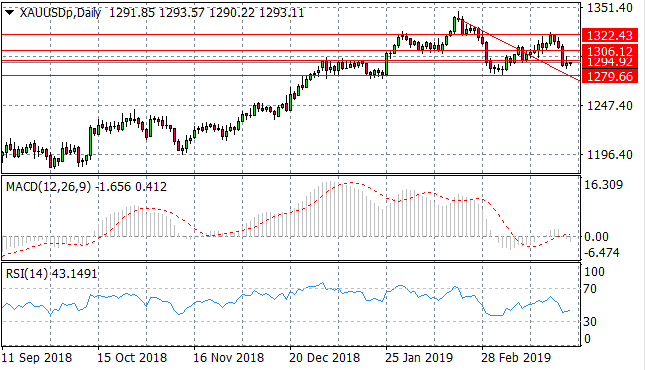
GOLD
Gold sellers have returned since the metal hit the 1322.43 price level. A series of breaks of key support areas has sent price action to test the 1294.92 price level. Momentum indicators are mixed with MACD breaking the zero line to the downside and RSI beginning a bullish recovery.
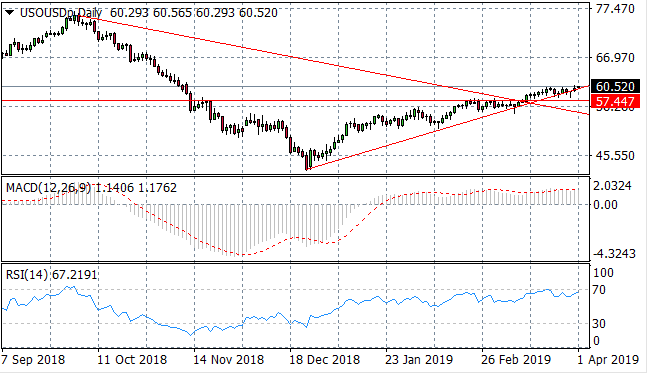
OIL
WTI buyers are still alive as the commodity continues a moderate uptrend, with several tests of an ascending trendline that has been acting as a support level. WTI is once again testing the $60 per barrel range, however, given persistent oversupply; has struggled to stabilize at this price. RSI also continues to test the 70 overbought area whilst MACD is flat in bullish territory.
Follow Us on Facebook:

