Can The USD/JPY Break Its Long-Term Bearish Trajectory?
- 24 Nov 2020
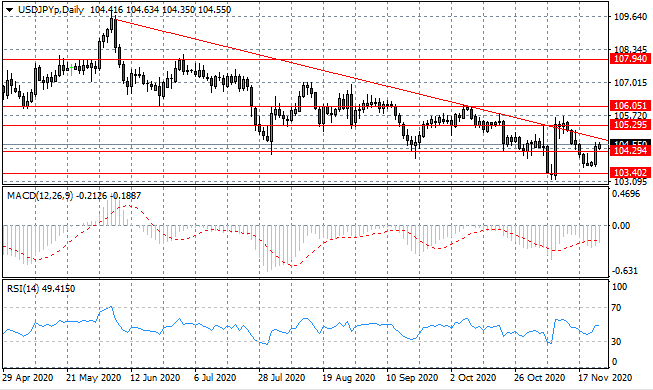
USD/JPY
The USD/JPY pair has recovered after breaking the 104.29 price line. Bullish momentum has taken the pair back towards the descending trendline, where typically, retracements occur. Price momentum has slowed since the break and it remains to be seen whether buyers can drive a trend change. Momentum indicators remain in bearish territory.
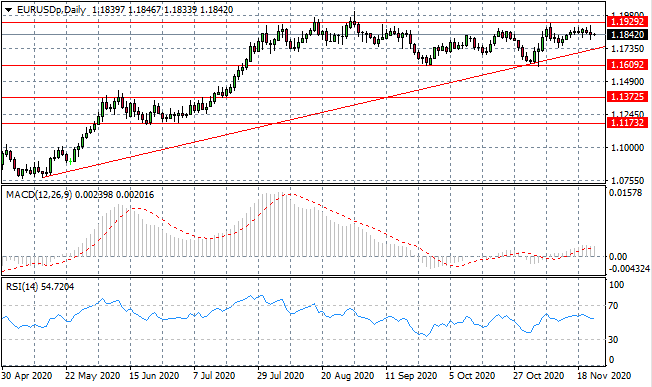
EUR/USD
The Euro continues to trade in range between the 1.160 and the 1.192 price levels. Price action appears to be stalling mod range and is heading closer to the ascending trendline which may provide some indication of near-term intentions of both buyers and sellers. Momentum indicators are moderately bullish.
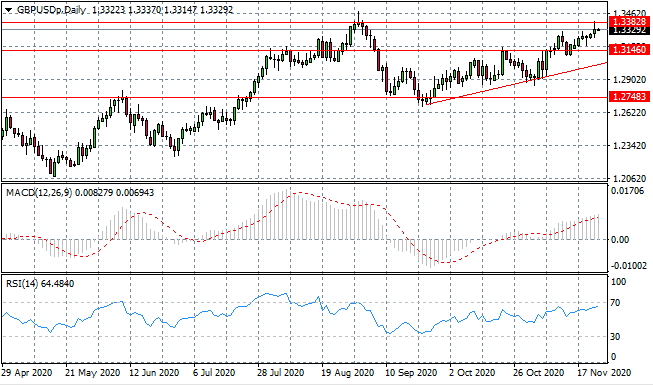
GBP/USD
The GBP/USD pair has once again rejected the 1.338 resistance area, yet the rally still appears to be gaining support. Another test of the resistance area seems inevitable, however, momentum seems too weak to drive a break. Momentum indicators are bullish, yet RSI is approaching overbought conditions.
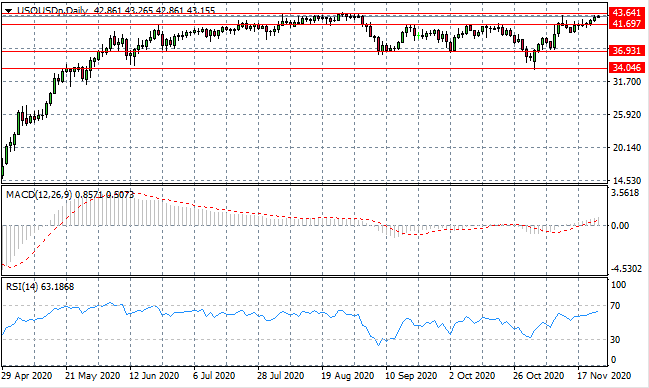
USOUSD
WTI has moved beyond the 41.69 resistance line to now test the 43.64 resistance area. Several previous attempts of the price level have resulted in an eventual pullback. Buyers’ conviction will be tested as current bullish momentum has not yet driven the break. Momentum indicators have moderate upward trajectories.
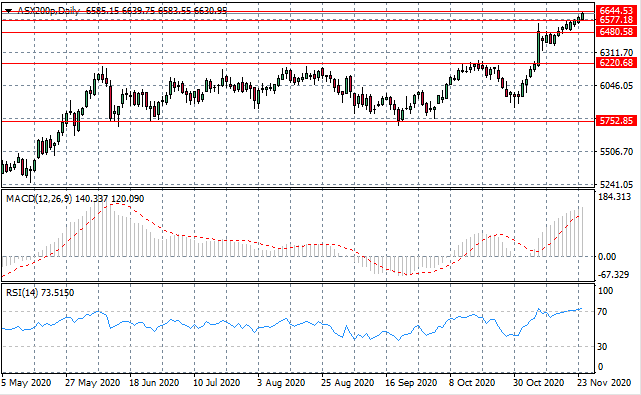
ASX200
The ASX200 continues to make ground; breaking several key resistance levels. The current test is the 6644.53 price level which represents a recent price high. The rally seems set to continue, with the last 8 trading sessions being bullish. Momentum indicators are bullish, with RSI testing overbought conditions.
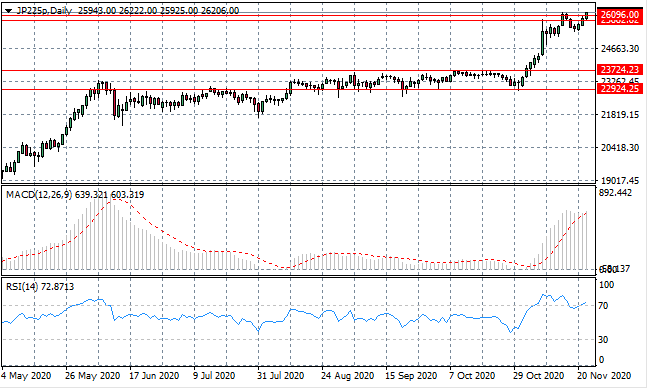
US500
After a short-lived pullback, the US500 has returned to test the 26096 resistance level representing the ceiling of a wide trading range. Influence is with buyers as a long-term uptrend has been established in the index despite a recent period of consolidation. Momentum indicators are bullish.
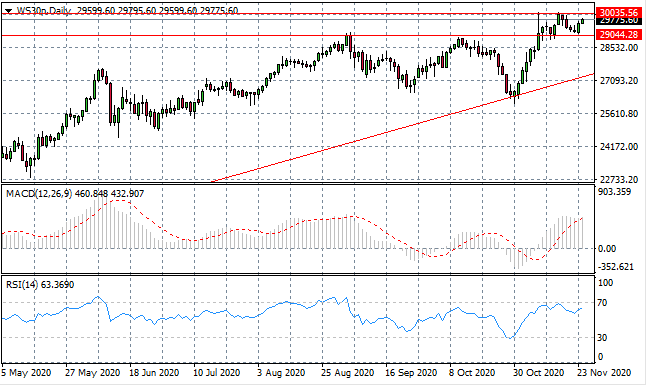
WS30
The WS30 index has bounced back from the 29,044 price level which represented the top of a previous price range. Another test of the 30,035.56 price level seems likely, the question is; do buyers have the appetite to drive the break? Momentum indicators are bullish with further upside potential.