Can WTI Break Range Held Since August?
- 12 Nov 2020
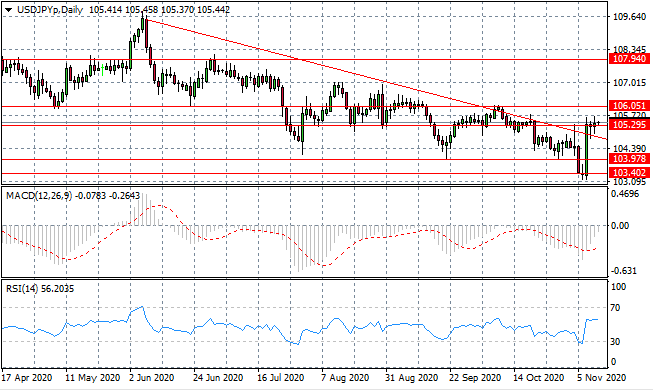
USD/JPY
USD/JPY has stalled at the 105.29 resistance level as volatility begins to spike yet neither buyers nor sellers are dominating price action. A full break of the resistance area is needed to confirm the trend change and indicate that buyers are in charge. Momentum indicators remain mixed.
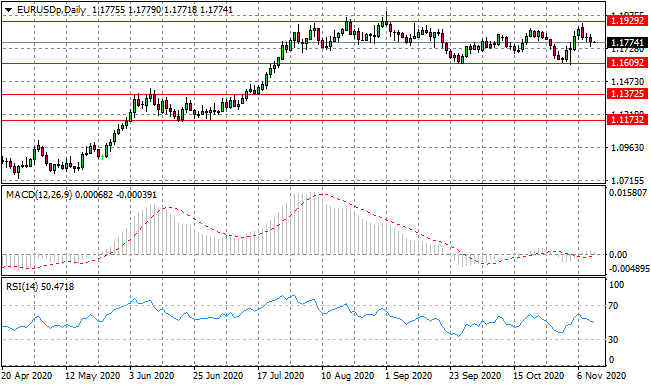
EUR/USD
Eurodollar oscillations are beginning to widen within the 1.160-1.192 trading range and price action will likely remain in range for the near-term. Sellers are currently dominating price action after a rejection at the range ceiling. Momentum indicators have stalled at the neutral zone.
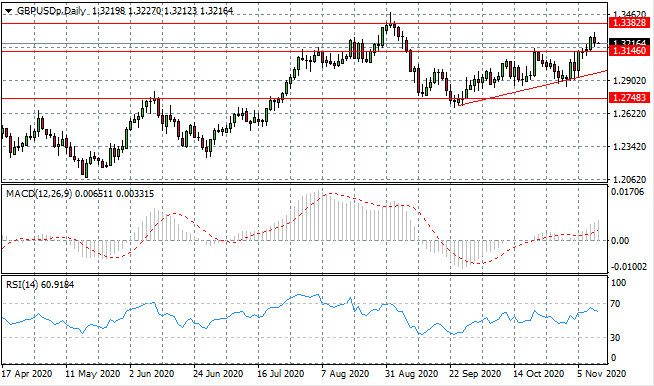
GBP/USD
GBP/USD sellers have returned after the break of the 1.314 resistance line, slowing the pace of the rally. A recent price high exists at the 1.338 price level and it remains to be seen whether buyers have the conviction to drive another test of the resistance area, given previous bearish retracements. Momentum indicators are bullish.
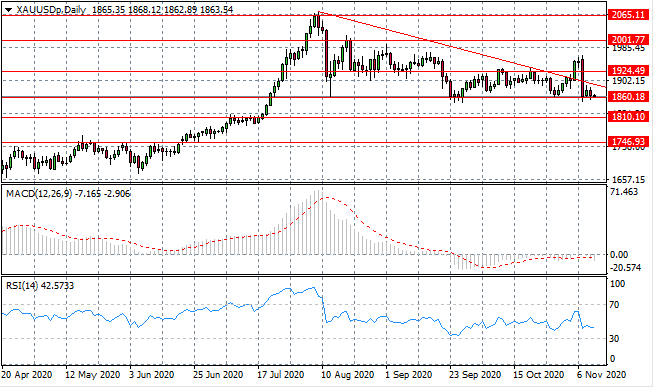
GOLD
Gold has been pushed back towards the floor of the descending triangle at the 1860 price line. Despite one spike through the upper bound, price action has maintained a bearish pattern. As the metal moves closer to the apex, the chances of a bearish breakout remain high. Momentum indicators are moderately bearish.
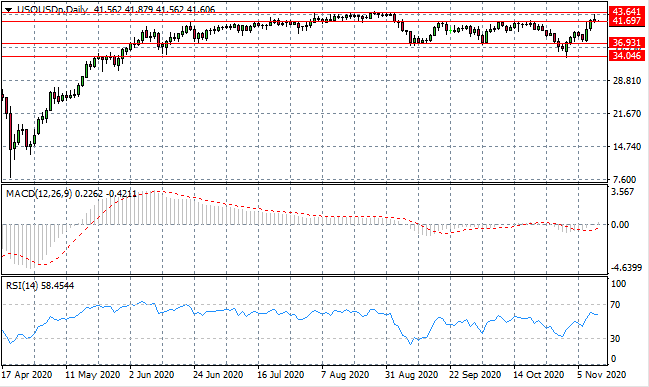
OIL
WTI has found support in recent trading as a series of bullish trading sessions has taken the commodity back towards the 43.64 ceiling. Sellers are still present which has stalled the rally and halted the break. Momentum indicators have upward trajectories.
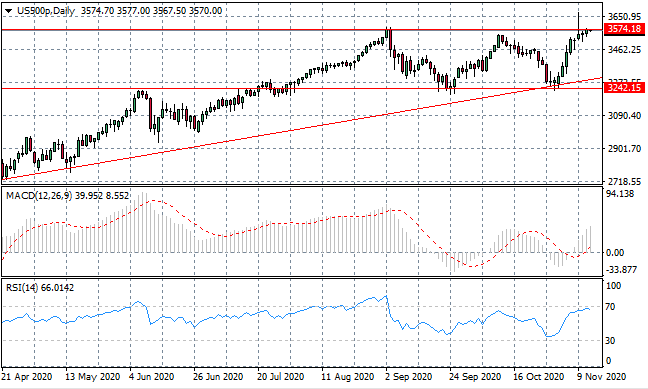
US500
The US500 has tested the 3574 price area for the last three trading session and despite a spike through at the start of the week, a break has yet to materialise. Long-term sentiment is bullish and oscillations continue to widen indicating that a break of the range ceiling could be on the cards. A shorter-term pullback may be imminent however, before the resumption of the rally. Momentum indicators are bullish, yet RSI indicates the index is overbought.
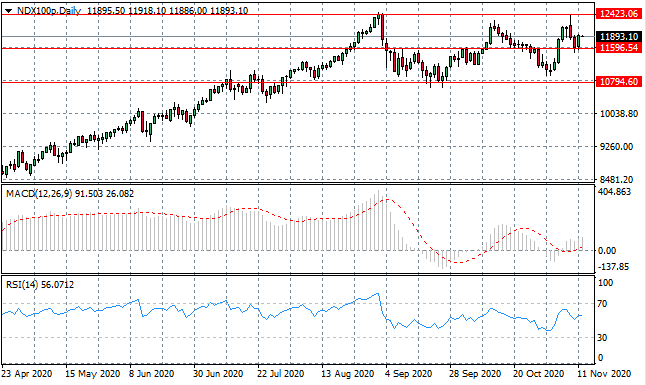
NDX100
The NASDAQ has moved into a tighter trading range in recent trading as the index may be preparing for further moves higher. A rejection of the 12,423 ceiling indicates that sellers are still active and perhaps the consolidation channel may hold in the near-term. Momentum indicators are bullish.