Eurodollar Volatility In Mid-Week Trading
- 17 Jun 2020
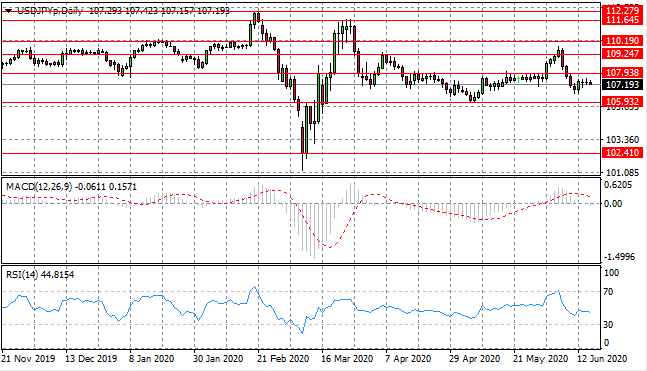
USD/JPY
The USD/JPY pair sell-off has stalled just below the 107.93 support level as buyers have returned to reverse price action. The pair will likely oscillate between the 105.93 and 107.93 price levels. Momentum indicators reflect bearish sentiment with downward trajectories.
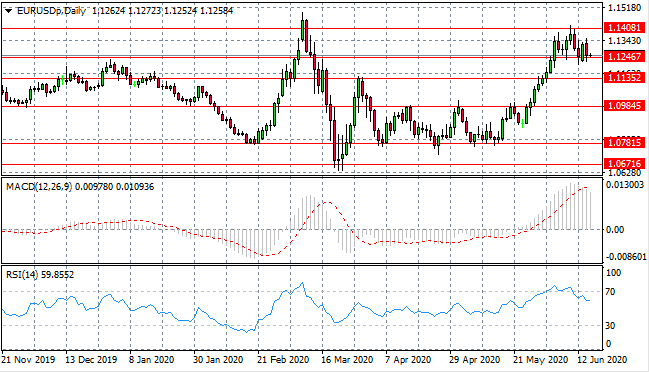
EUR/USD
The Eurodollar remains volatile as both buyers and sellers attempt to influence price action. The 1.124 support line remains a sticking point for the pair, therefore the 1.124-1.140 trading range will remain intact. Momentum indicators have stalled in bullish territory with RSI moving below the 70 overbought line.
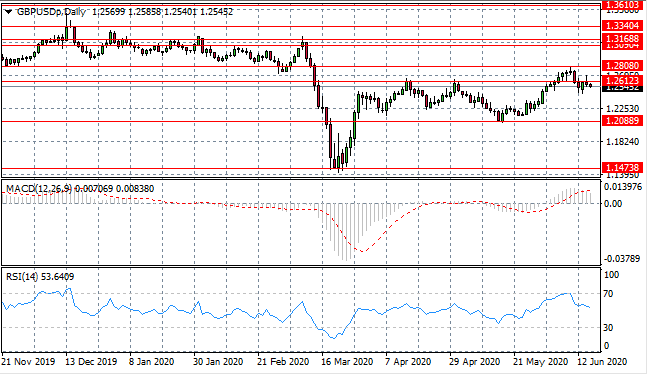
GBP/USD
The GBP/USD pair broke the 1.261 resistance level yet the break was not sustained. Currently, buyers appear to lack the conviction to drive price action to a new trading range. Momentum indicators are turning bearish with RSI breaking the 70 resistance line.
USD/CHF
The USD/CHF test of the 0.942 support level has resulted in a rebound taking price action back towards the 0.951 resistance level. Price action has stalled at this level with a previous trading range beginning at the 0.959 resistance area. Momentum indicators have upward trajectories.

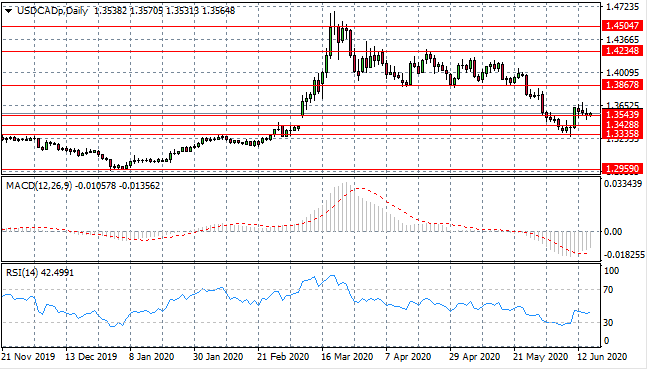
USD/CAD
The USD/CAD has found support after an extended sell-off as the US Dollar makes a revival. A series of small-bodied candles represent exhaustion after a strong bullish move resulted in a break of several resistance levels. A new range may be established between the 1.354-1.386 price levels. Momentum indicators have stalled in bearish territory.
SILVER
Silver has returned to the 17.58 price line and attempted bullish breaks have not been sustained. The pair will continue to hug this price line until some fundamental news changes the metal’s course. Momentum indicators have a bearish bias with RSI pulling away from overbought conditions.

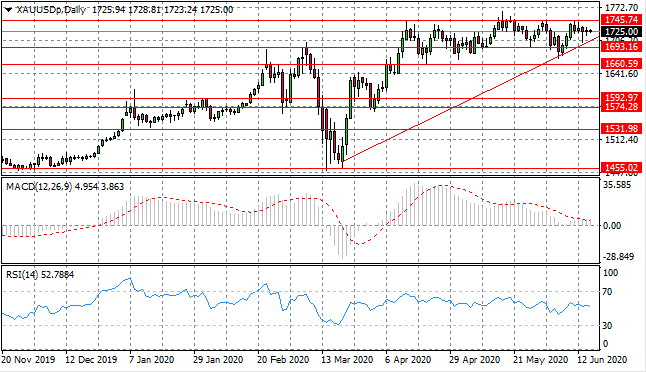
GOLD
Gold buyers have returned to take the metal back towards the 1745.74 resistance line and yet again, the price area represents a sticking point. A breakout may be imminent, however, as a longer-term ascending triangle pattern reaches the apex. Momentum indicators have flattened in neutral/bullish territory.
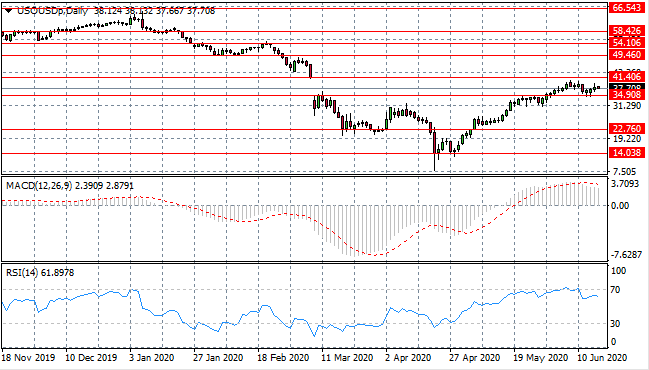
OIL
WTI may make another attempt at the 41.40 resistance line although moves are lacking conviction with very few new developments. The $35-40 per barrel range may be a stabilizing price and represents a level where certain OPEC members can find production profitable. Momentum indicators remain in bullish territory although RSI has flattened just below the overbought line.