GOLD Breaks Out Of Buy Channel
- 28 Feb 2019
Kickstart your new year with the best USD50 bonus campaign. Limited-time offer! Get it now!
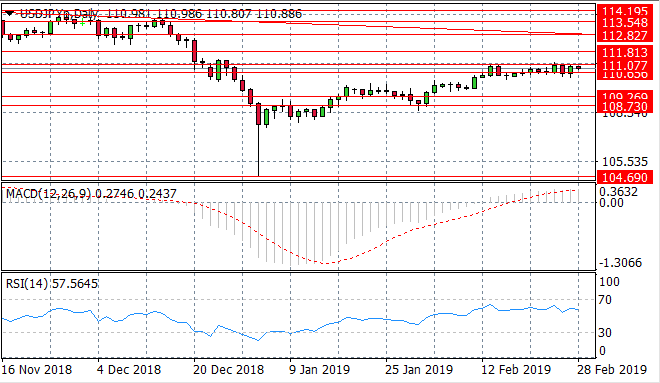
USD/JPY
The USD/JPY pair continues to bounce between the 110.65 and the 111.07 price levels with neither buyers nor sellers dominating as volatility remains low in the pair. At the same time, RSI has reverted to a downward trajectory, pulling away from overbought conditions. MACD remains in bullish territory.
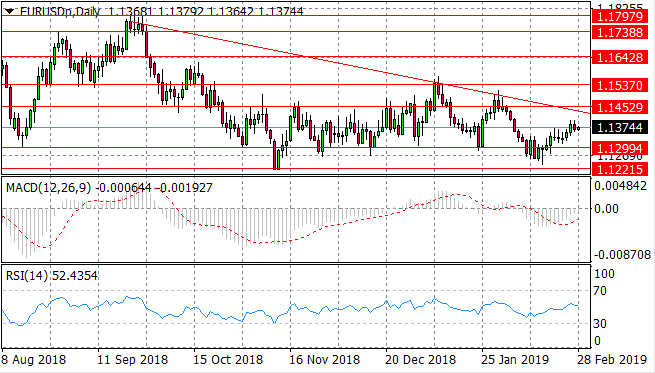
EUR/USD
The EUR/USD pair has broken the 1.129 price level after a sharp rise in buying pressure and the pair is now headed towards the descending trendline. A trading range between the 1.129 and 1.145 price levels has been established. Momentum indicators both support the bullish sentiment.
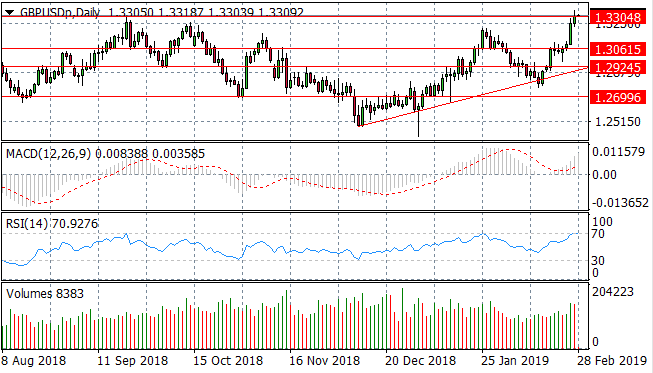
GBP/USD
The GBP/USD pair is testing a recent price high at the 1.330 resistance level, however, selling pressure has begun. This resistance line has proven to be a real hurdle for buyers in the past, with failure resulting in price action dropping back. At the same time, RSI has reached overbought conditions, however buying volume continues to climb.

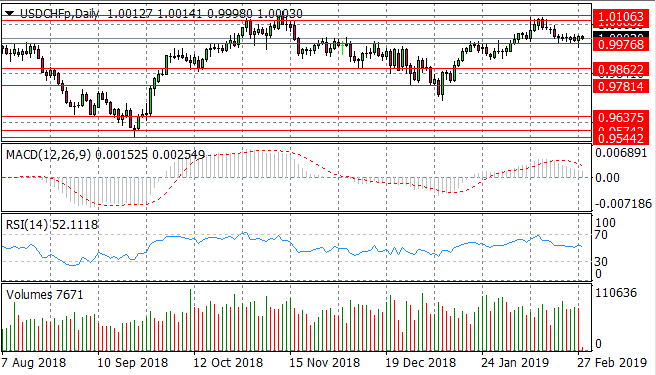
USD/CHF
The USD/CHF pair has pulled back towards the 0.997 price level and has stalled at this support level. RSI is testing the default line and has flattened in neutral territory. MACD is commencing a bearish reversal.
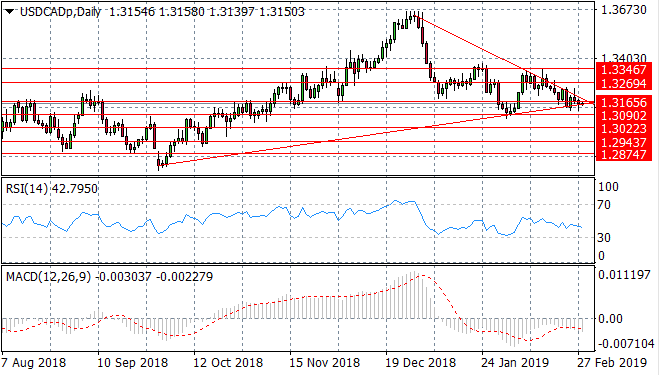
USD/CAD
The USD/CAD pair has entered into a symmetrical triangle with the upper resistance line containing price action currently. The pair is edging closer to the apex, with the probability of a breakout rising, given the previous uptrend, the breakout is expected to be bullish. RSI is approaching the 30 support level and MACD remains in bearish territory.
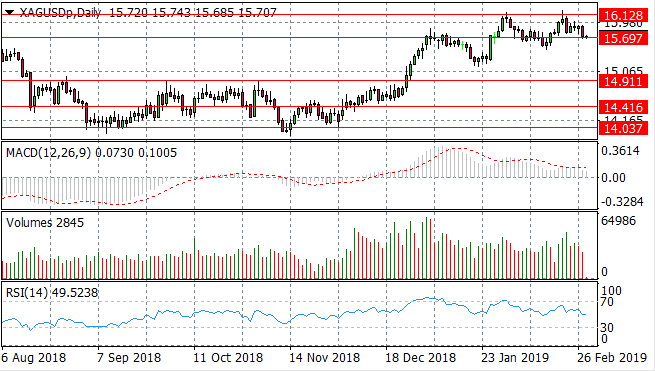
SILVER
Silver sellers have pushed price action to test the 15.69 price level once again. A new trading range may have been established between the 15.69 and 16.12 price levels. Momentum indicators are moderately bullish, however, momentum is decelerating.
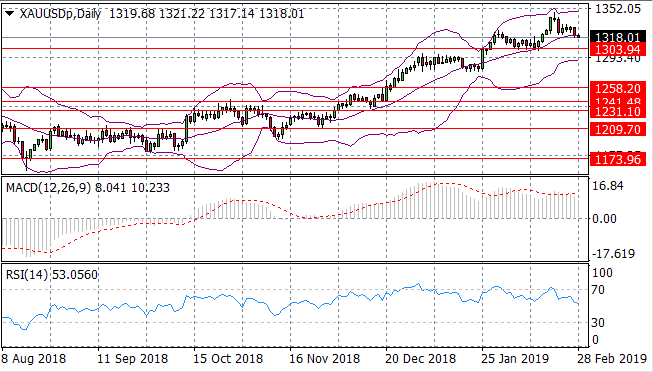
GOLD
Gold is maintaining the bullish trend over the longer term. The metal is languishing in the bullish/buy channel which appears to forming as a trading range, however price action is testing the mid-line at the 20 period moving average. A break would indicate a downtrend. At the same time, RSI has a sharp downward trajectory.
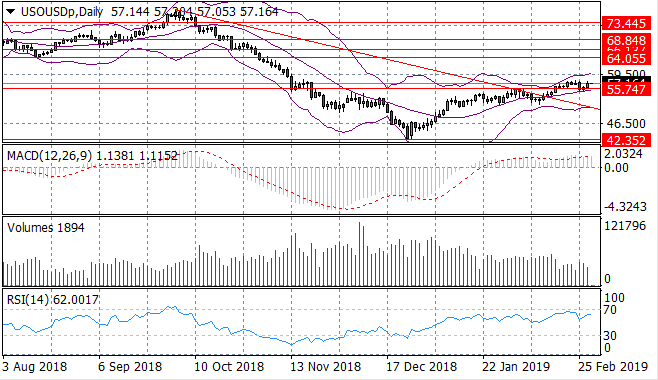
OIL
WTI buyers have lost steam resulting in a moderate break of the 55.74 resistance line as a result, which has now formed as a support level for the commodity. The next target will be $60 per barrel at which point prices may stabilise. Momentum indicators are bullish once again.