Gold Surges To New Highs
- 8 Jul 2020
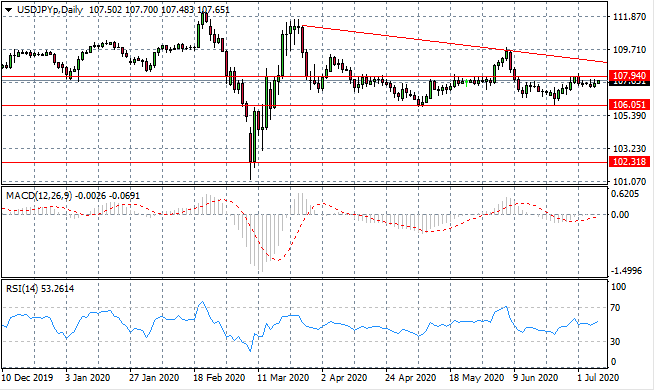
USD/JPY
The USD/JPY pair has oscillated between the 106.51 and 107.94 price levels in recent trading and the pair is testing the 107.94 resistance level. This dance may continue for some time especially given the fact that this range was recently difficult to break. Momentum indicators have upward trajectories.
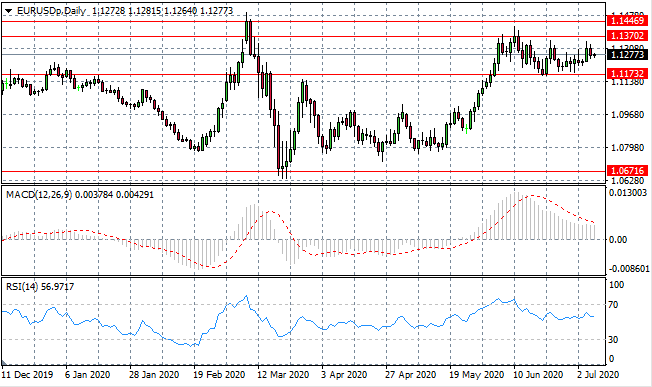
EUR/USD
Eurodollar buyers have returned and the question is whether the pair can drive a break at the 1.137 resistance line. A breakout of sorts is underway after price action narrowed in recent trading, however, sellers remain active. Momentum indicators have flattened in bullish territory.
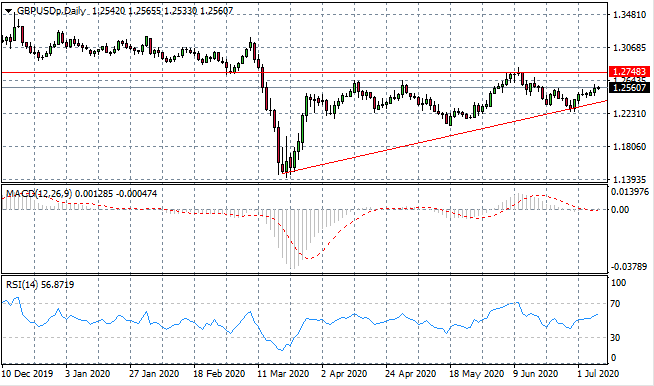
GBP/USD
The GBP/USD pair has rebounded from the ascending trendline, as price action forms an ascending triangle pattern. A breakout is more likely the closer to the apex and current moves suggest waning conviction from buyers. Momentum indicators have moderate upward trajectories.
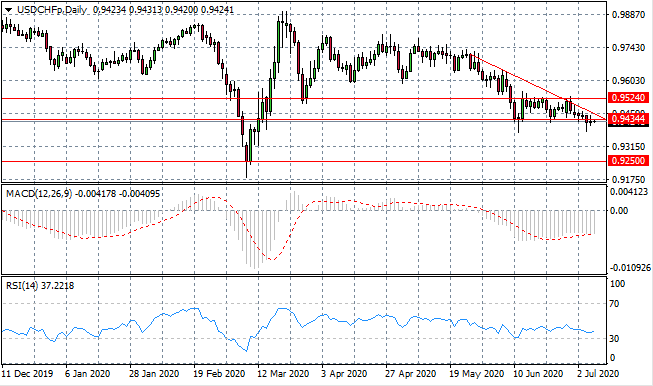
USD/CHF
The USD/CHF pair has broken a key support level at the 0.943 price level, where previously, sellers had been held. A descending triangle pattern indicates that there will be a continuation of the bearish moves in line with a longer-term downtrend. Momentum indicators have flattened in bearish territory.
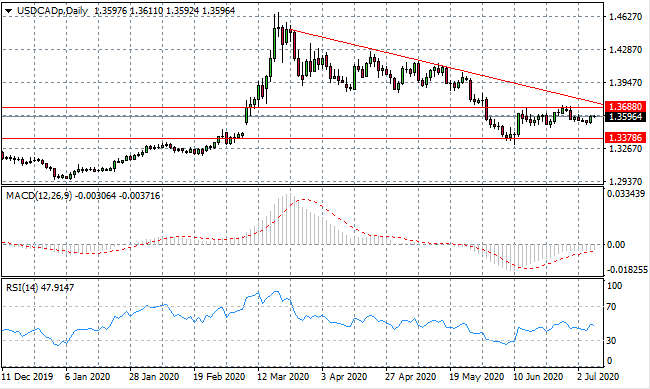
USD/CAD
The USD/CAD rejected the 1.368 resistance line, however, a moderate rally appears to be forming against a longer-term downtrend. Another attempt may be made to break the 1.368 resistance line. Momentum indicators have moderate upward trajectories.
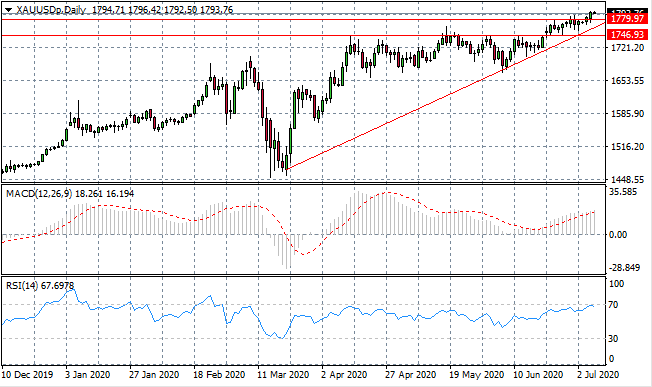
GOLD
Gold has broken the 1779.97 resistance line as buyers appear to have regained strong conviction. A support level exists at the ascending trendline, yet several touches have ignited further bullish momentum. Momentum indicators are strongly bullish with RSI testing overbought conditions.
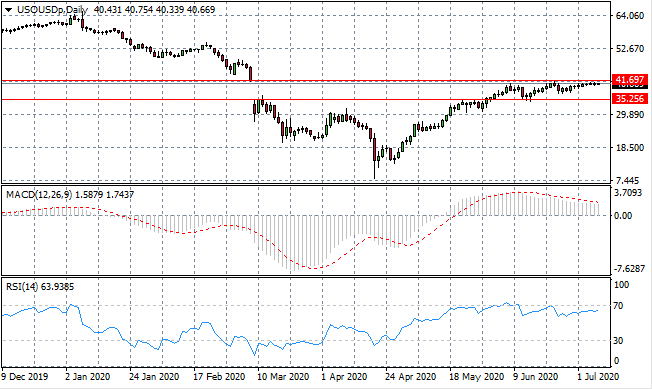
OIL
WTI appears to be making another attempt at the 41.69 resistance line despite scant conviction from buyers. The resistance represents the ‘gap-fill’ line, which particularly significant, as it represents a complete price recovery to a trading range established before the Covid-19 sell-off. Momentum indicators have flattened in bullish territory.