HK50 Breaks Key Resistance Level
- 19 Jan 2021
USD/JPY
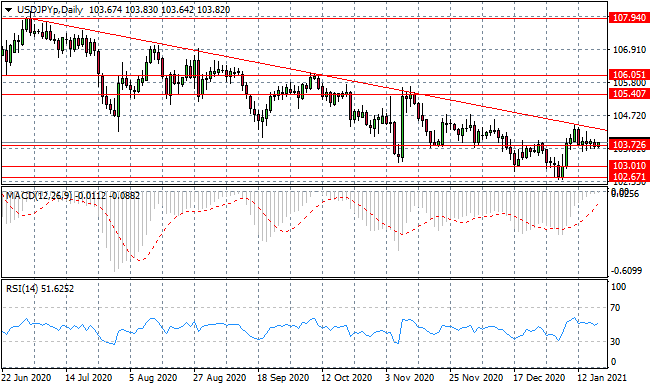
The USD/JPY pair has stalled at the 103.72 support level for the last 5 trading sessions as neither buyers nor sellers are dominating near-term price action. The narrowing of oscillations along the support level may indicate a potential breakout. Momentum indicators have stalled in neutral territory.
GBP/USD
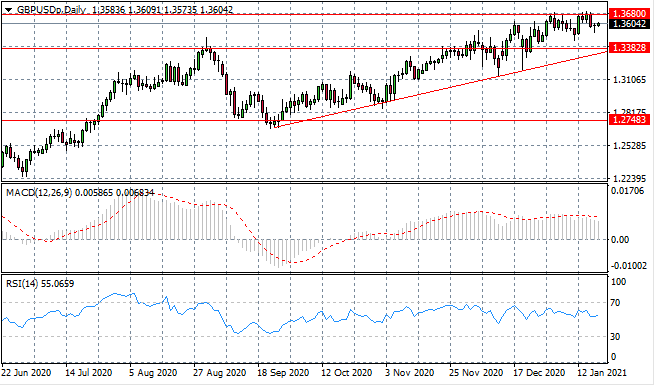
The GBP/USD pair has pulled back from the 1.368 resistance line, yet with oscillations presenting registering higher lows, another attempt at the resistance area seems likely. Longer-term, the uptrend remains intact. Momentum indicators have flattened in bullish territory.
EURUSD
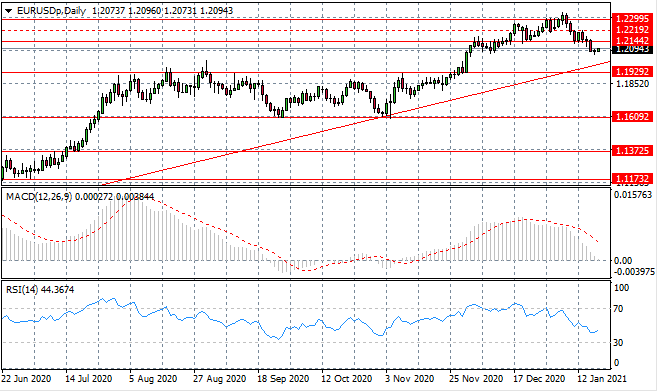
The EURUSD pair has broken the 1.214 support level and the sell-off has stalled immediately after the break. The correction may be a truer reflection of current economic conditions, where the exchange rate seems artificially inflated. Momentum indicators are bearish.
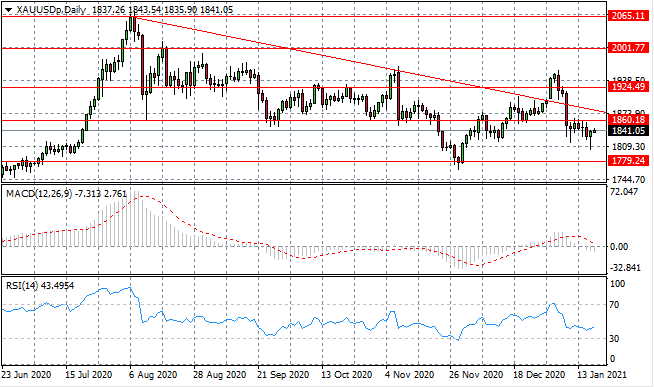
XAUUSD
XAUUSD remains in the 1779-1860 trading range, as buying pressure after the break has resulted in the range being maintained. Another test of the 1860 ceiling seems most likely in the near-term, given the rise in buying activity. Momentum indicators have flattened in bearish territory.
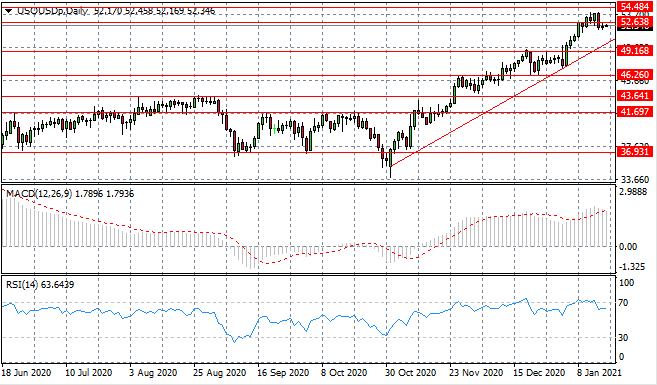
USOUSD
USOUSD appears to have settled at the 52.63 support level. It would appear, therefore, that sellers do not have the conviction to drive a trend change and the current move is an adjustment after the rally. Momentum indicators are pulling away from overbought conditions yet remain bullish.
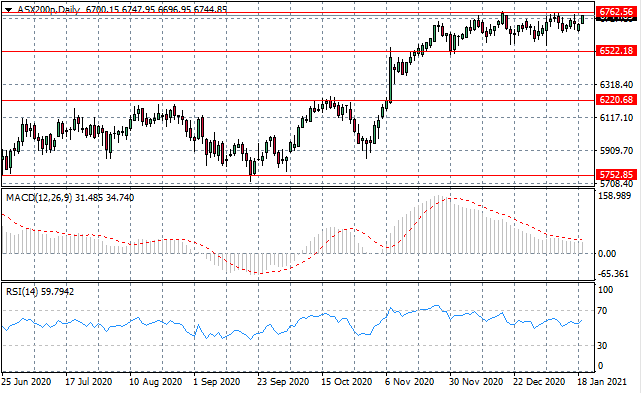
US500
The ASX200 is making another attempt at the 6762 resistance area as the index continues to oscillate within range between the 6522 and 6762 price levels. On several previous occasions, the index has rejected this price level, however, if tests continue a break seems inevitable. Momentum indicators have flattened in bullish territory.
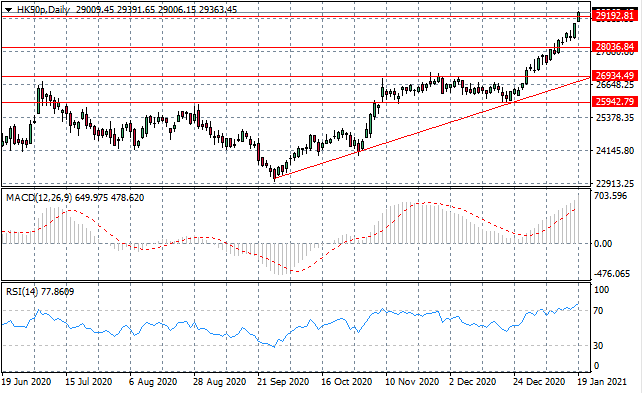
HK50
The HK50 index has broken a price ceiling not touched since January 2020. The break is significant and indicates a return to pre-Covid outbreak levels, as well as strong bullish momentum. The breakaway gap further confirms the bullish bias. 28,347 price line in an apparent reversal. Momentum indicators are strongly bullish territory with RSI breaking the 70 line.