Is The GBP/USD Rally Over?
- 21 Oct 2019
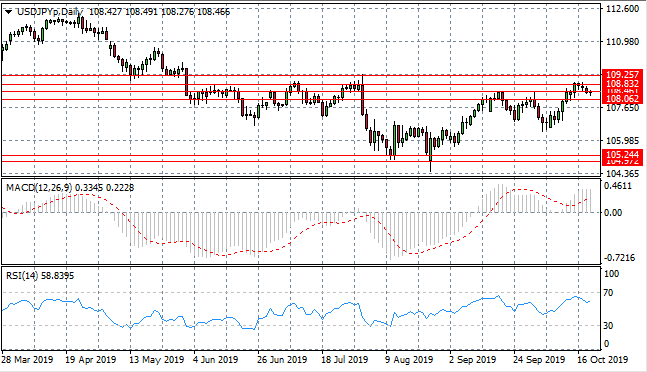
USD/JPY
The USD/JPY pair has failed to break the 108.83 resistance line which has resulted in price action back tracking to the 108.46 support level. Price action is likely to remain in the 108 price range. Momentum indicators remain in bullish territory, although RSI is turning away from overbought conditions.
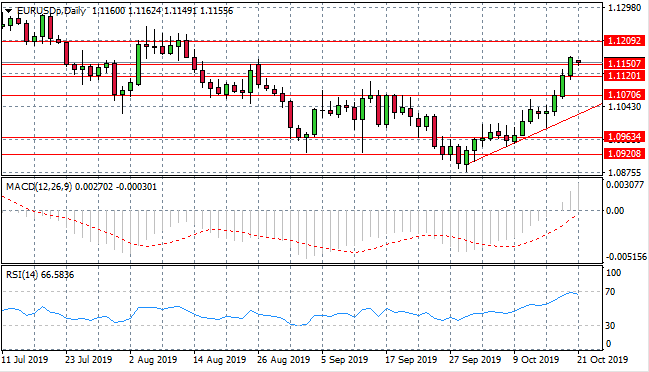
EUR/USD
The Eurodollar has broken but failed to clear the 1.112 resistance line, which represents a previous support area for the pair. Sellers appear to have returned to the pair after the break. Momentum indicators remain bullish with MACD breaking the zero line however RSI is pulling back from overbought conditions.
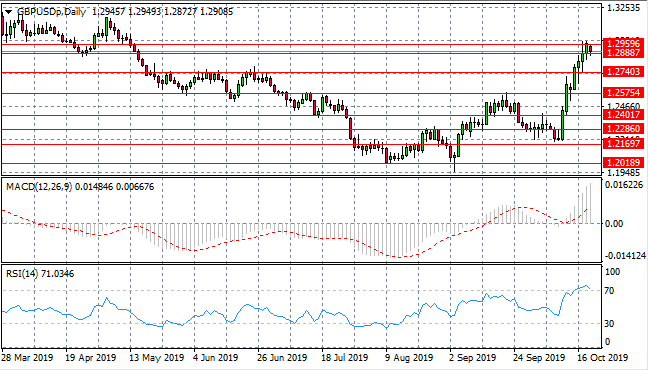
GBP/USD
The GBP/USD pair is once again testing the 1.288 support line after a test of the 1.295 resistance area. Out of the last eight trading sessions; six have been bullish, however, the return of sellers in today’s trading could signal the end of the uptrend. Momentum indicators are in bullish territory, yet RSI is pulling back to the overbought line.
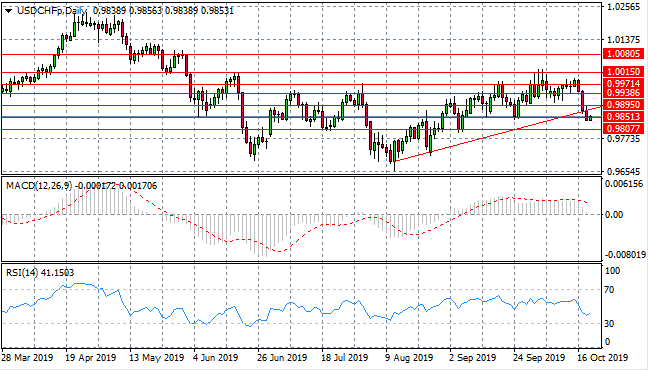
USD/CHF
The USD/CHF pair has pulled back once again to break the 0.985 support level and the ascending trendline. On previous occasions, this has been a strong support area from which price action has rebounded. Momentum indicators have downward trajectories.
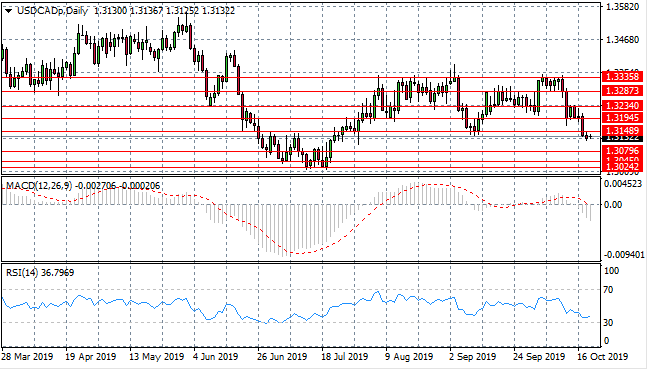
USD/CAD
The USD/CAD pair has returned to break the 1.314 support level which may result in price action heading towards the 1.307 support line. A break is significant as price action has oscillated between the 1.314 and 1.333 price levels in recent trading. Momentum indicators are bearish, yet moving closer to oversold conditions.
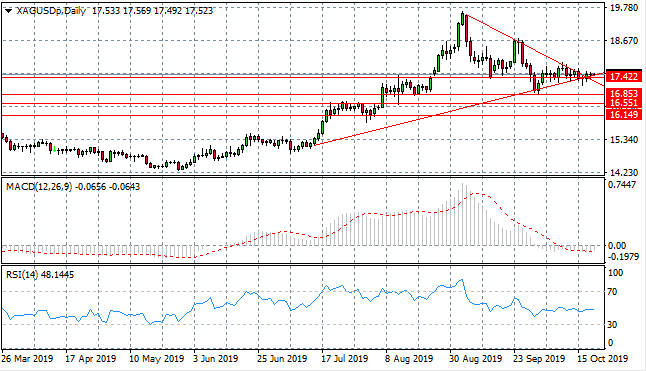
SILVER
Silver has moved through the apex of a symmetrical triangle which should result in a bullish breakout given the previous trend was bullish. Instead, the metal is languishing at the 17.42 support level with a series of doji candles indicating that there is indecision. Momentum indicators remain in bearish territory.
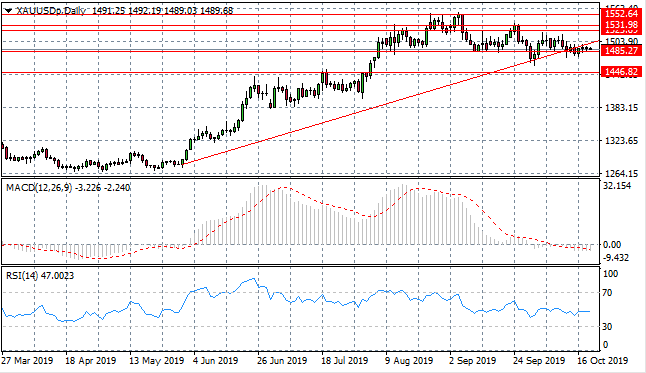
GOLD
Gold has been trading horizontally, within a tight trading range recently. Price action has broken the ascending trendline, which indicates sentiment has turned bearish. Price action continues to test the 1485.27 support level. Momentum indicators remain in neutral/bearish territory.
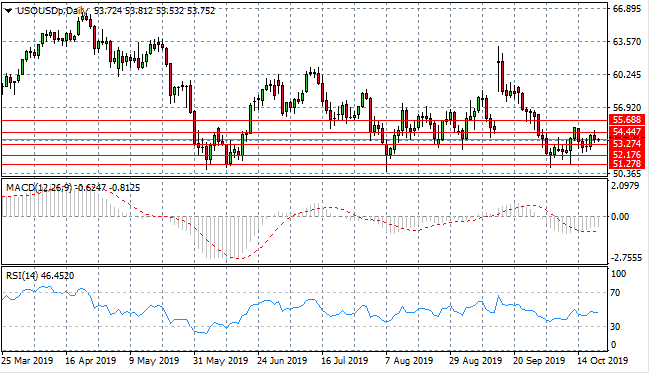
OIL
WTI has broken the 53.27 support level with buyers pushing price action towards the $54 per barrel price range. Given the geopolitical tensions, it seems likely that oil price volatility will continue. Momentum indicators remain moderately bearish.