NDX100 Tests Key Resistance Area
- 17 Feb 2022
USD/JPY
The USDJPY pair has stalled at the 115.41 support level with small-bodied candles, indicating that neither buyers nor sellers have the appetite to drive a trend change. The ascending trendline remains intact as a key support level for the pair. Momentum indicators have flattened in bullish territory.

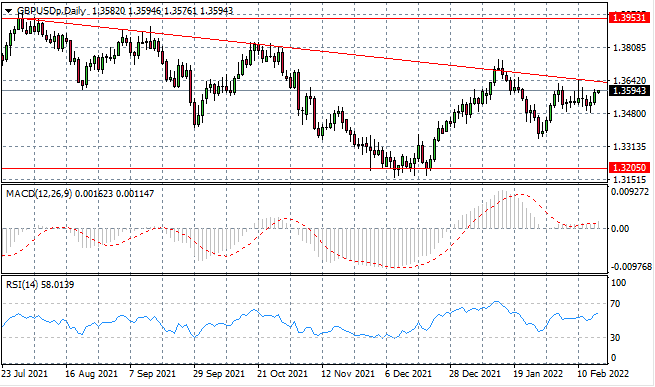
GBP/USD
GBPUSD buyers have returned to the pair and it appears that another attempt will be made at the descending trendline. Previous attempts have resulted in a bearish rebound and the pair then oscillates lower. Momentum indicators have flattened in neutral/bullish territory.
EURUSD
The EURUSD has begun to bounce back after a short-term sell-off lost steam. Price action will head back towards the 1.144 resistance line which has been an obstacle for buyers on two previous occasions. Momentum currently appears subdued and insufficient to drive the break.

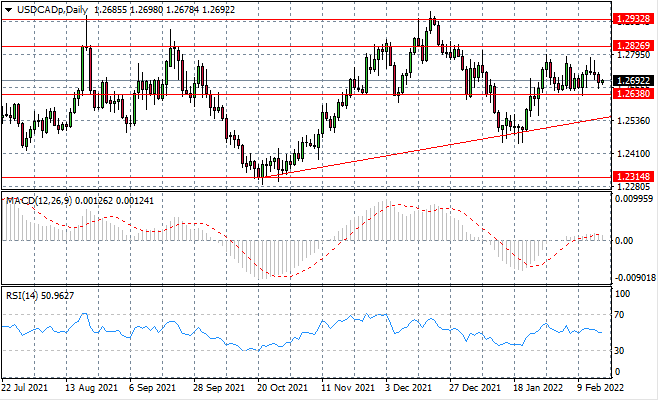
USDCAD
The USDCAD is consolidating between the 1.263 and 1.282 price levels and price action continues to narrow within range. A breakout could be on the cards, yet downside moves have so far been contained by the ascending trendline. Momentum indicators have flattened in neutral territory.
XAUUSD
XAUUSD has moved to test the 1869 resistance line and so far the metal has been contained at this price level. Bullish attempts have been contained by a rise in selling pressure and longer-term sentiment has a bullish bias. Momentum indicators suggest that further upside is limited with RSI indicating the metal is overbought.

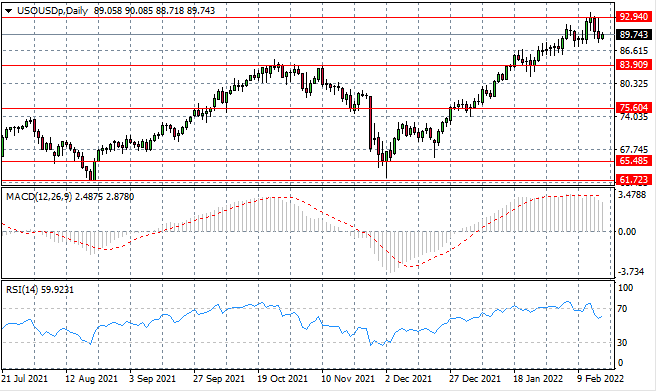
USOUSD
The USOUSD pair has begun to pullback from the 92.94 price ceiling as selling activity has begun to rise rapidly. The commodity has struggled to sustain the $90 per barrel range and is likely to oscillate within the current range until a major change in fundamentals.
NDX100
NDX100 is beginning to move back towards the 15,169 resistance line, however, the index will have to overcome a key resistance area at the descending trendline. A doji candle in yesterday’s trading already denotes waning bullish sentiment.

