NDX100 Tests Key Resistance Level
- 13 Apr 2021
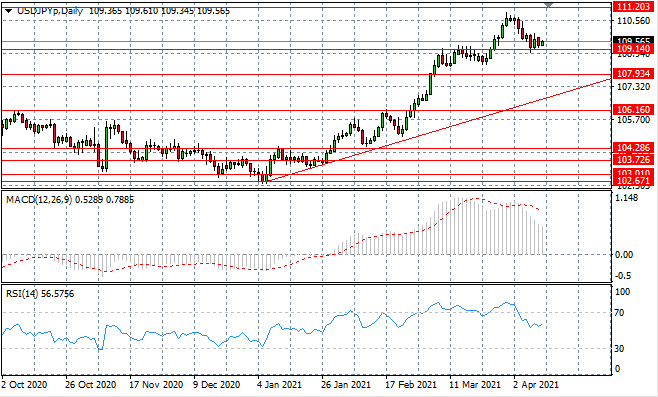
USD/JPY
USD/JPY oscillations have narrowed at the 109.14 support level, where smaller-bodied candles indicate indecision from both buyers and sellers. Given the lack of bearish conviction, the pullback may just represent a cool down in the rally rather than a reversal. Momentum indicators have bearish trajectories.
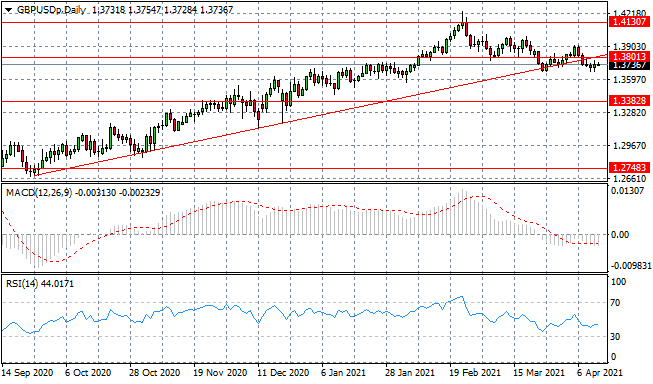
GBP/USD
The GBPUSD break indicates that the moderate bearish sentiment that is driving the pair will continue. Sellers appear to lack the conviction to form significant moves yet the break of the ascending trendline is the first sign the rally is coming to an end. Momentum indicators are bearish.
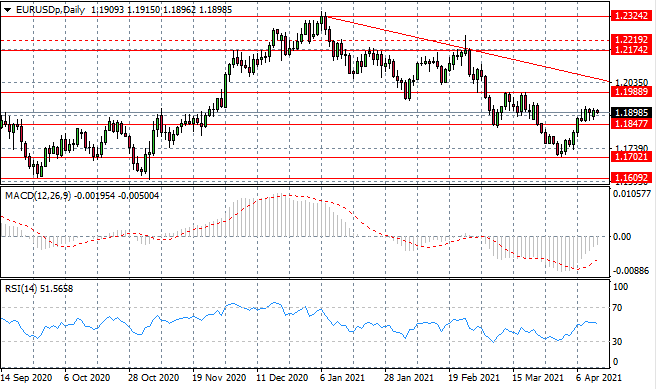
EURUSD
The Eurodollar has broken the 1.184 resistance line, yet price action has stalled within the 1.184-1.198 trading range. Further downside may be on the cards given the longer-term trajectory of price action. Momentum indicators are bullish.
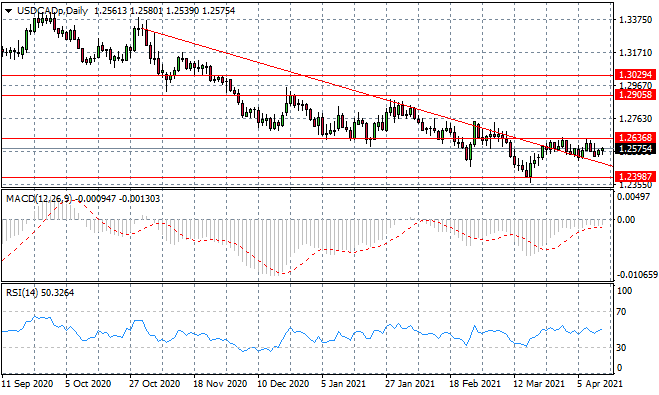
USDCAD
The USDCAD pair continues to float just below the 1.263 price level after breaking the descending trendline. Horizontal price action will remain unless there is a change in fundamental factors. Momentum indicators have fattened in neutral territory.
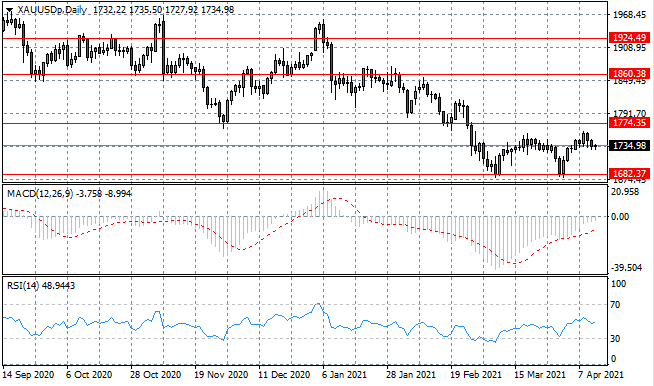
XAUUSD
XAUUSD may make another attempt to break the 1774.35 resistance line as higher highs and higher lows indicate bullish sentiment is driving price action currently. Up until now though, conviction has been low. Momentum indicators have upward trajectories.
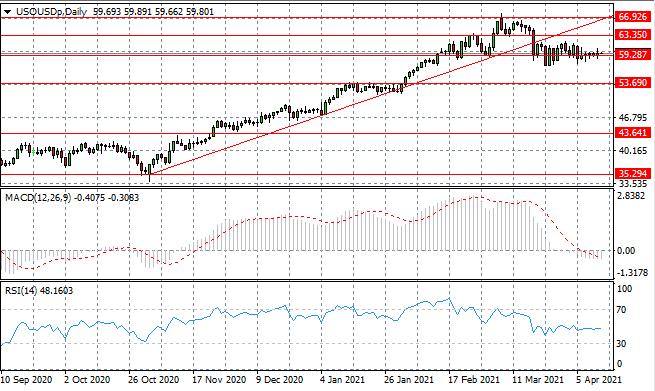
USOUSD
The USOUSD cannot breakaway from the $59 per barrel mark, as doji candles represent a tailing off of the bearish move that drove the break of the ascending trendline- a key support area. Fundamental factors are likely to be the biggest driving factor of price action going forward. Momentum indicators have flattened in bearish territory.
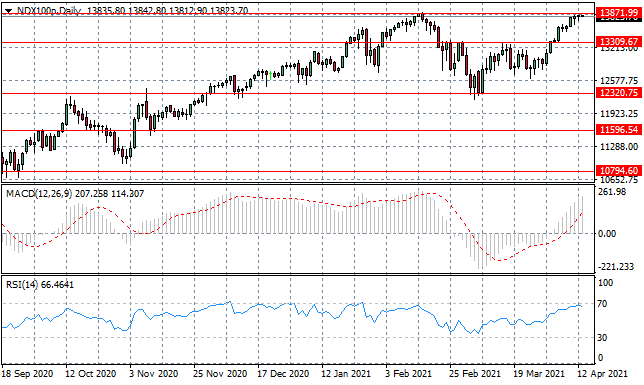
NDX100
The NDX100 is testing a recent price ceiling at the 13,871.99 resistance level. The current move shows strong bullish conviction, the question is: can it drive a break? Momentum indicators are bullish with RSI testing the overbought line.