New Trading Range For GBP/USD Pair?
- 26 Feb 2019
Kickstart your new year with the best USD50 bonus campaign. Limited-time offer! Get it now!
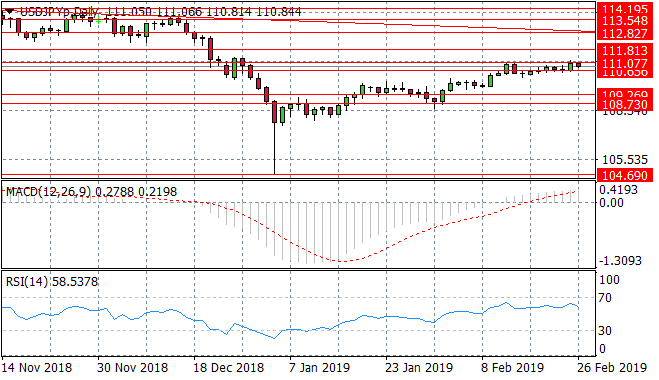
USD/JPY
The USD/JPY pair has stalled at the 111.07 price level and price action indicates indecision with neither buyers nor sellers dominating, with low volatility in the pair. At the same time, RSI has reverted to a downward trajectory, pulling away from overbought conditions. MACD remains in bullish territory.
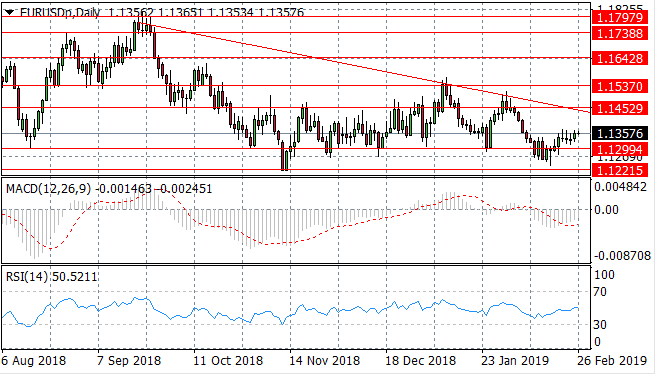
EUR/USD
The EUR/USD pair has broken the 1.129 price level after a sharp rise in buying pressure, however, this has been followed by a series of doji candles indicating a pause in the trend. A trading range between the 1.129 and 1.145 price levels has been established. Momentum indicators both appear to be returning from bearish positions.
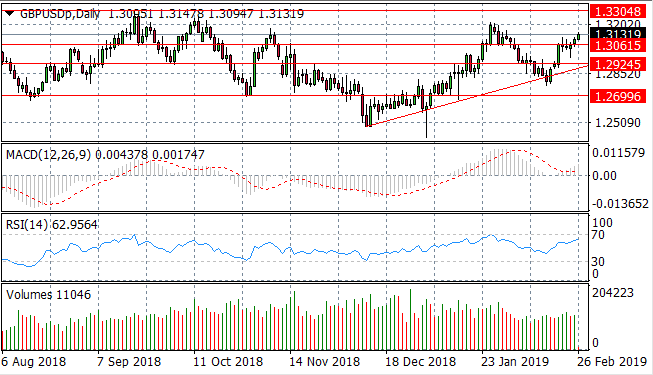
GBP/USD
The GBP/USD pair has finally broken the 1.306 price level which represents a key resistance area for the pair. A new trading range may form between the 1.306 and 1.330 price levels. Momentum indicators have turned bullish with sharp upward trajectories. It is important to remember the fundamental factors which are currently impacting this pair.

USD/CHF
The USD/CHF pair has pulled back towards the 0.997 price level and has stalled at this support level. RSI is testing the default line and has flattened in neutral territory. MACD is commencing a bearish reversal.

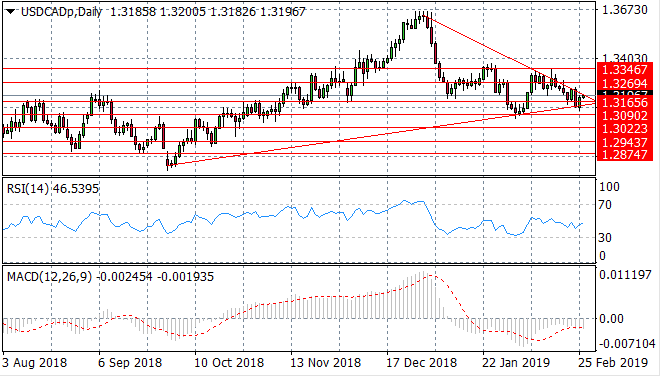
USD/CAD
The USD/CAD pair has entered into a symmetrical triangle with the upper resistance line containing price action currently. Another failure at the lower bound of the triangle has resulted in the pair testing the descending trendline once again. The pair is edging closer to the apex, with the probability of a breakout rising. RSI is approaching the 30 support level and MACD remains in bearish territory.
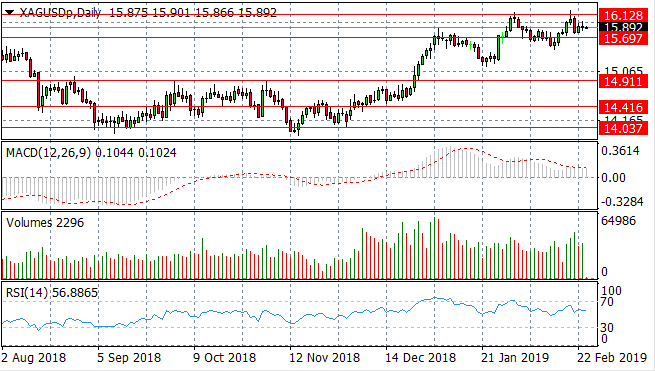
SILVER
Silver buyers have returned to push price action towards the 16.12 price level. The result has been a failure at this price high. A new trading range may have been established between the 15.69 and 16.12 price levels. Momentum indicators are moderately bullish, however, momentum is decelerating.
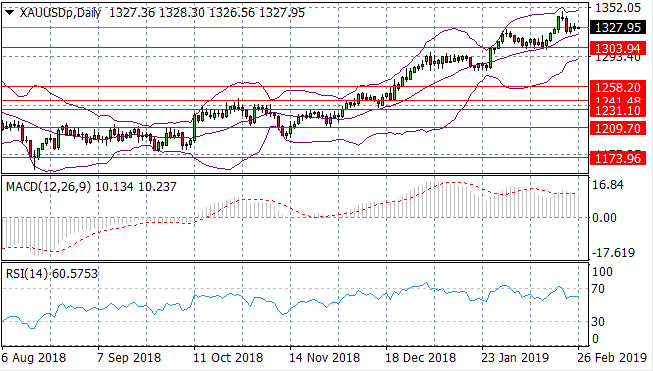
GOLD
Gold is maintaining the bullish trend over the longer term. The metal is languishing in the bullish/buy channel which appears to forming as a trading range, acting as support and resistance. Momentum indicators support bullish sentiment and RSI is returning towards the 70 resistance line.
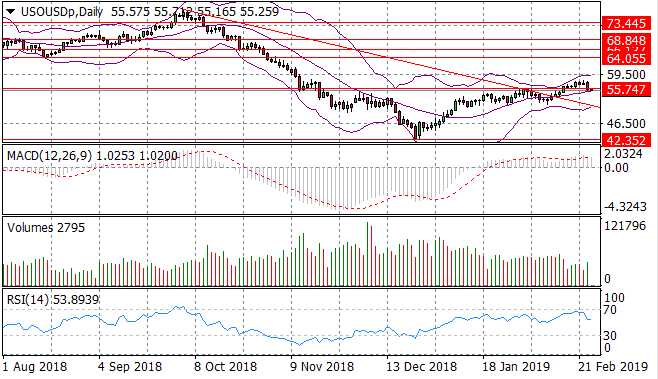
OIL
WTI buyers have lost steam resulting in a moderate break of the 55.74 resistance line as a result. The next target will be $60 per barrel at which point prices may stabilise, however price action has been falling despite declining selling volume. Momentum indicators are pulling back from bullish positions.