Potential Breakout For WTI?
- 15 Nov 2019
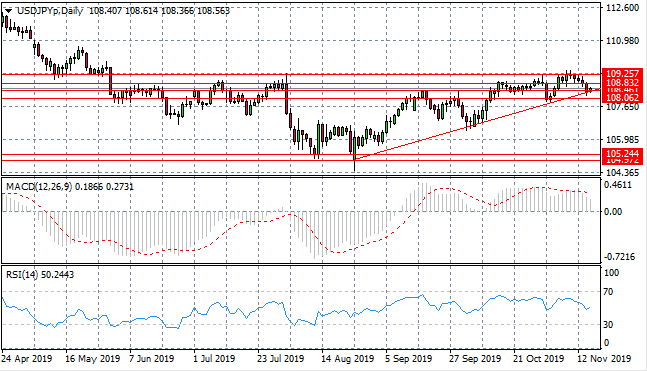
USD/JPY
The USD/JPY pair has reverted after testing the 109.25 resistance level. Sentiment has turned bearish with the pair now testing the 108.46 price level. Another support level for the pair is represented by the ascending trendline, where price action seems set to return. Momentum indicators have begun downward trajectories.
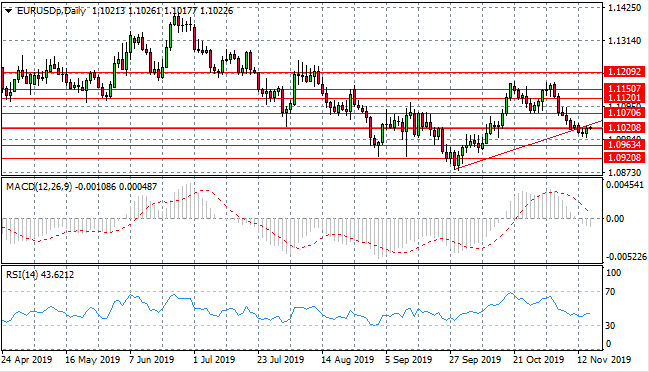
EUR/USD
The Eurodollar has continued to sell-off taking price action back to break both the 1.102 support level and the ascending trendline. The break has been met with the return of buyers resulting in another test of the 1.102 price level. Momentum indicators have downward trajectories supporting the bearish bias.
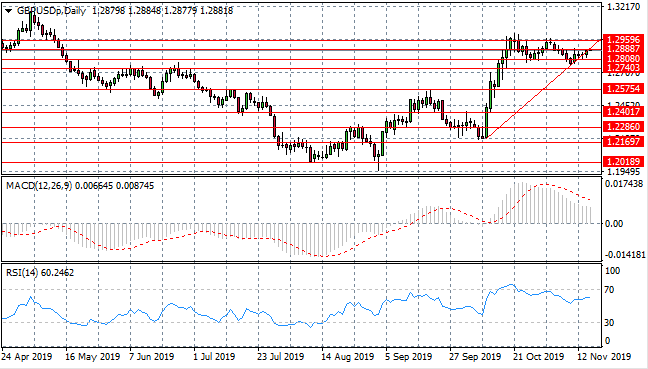
GBP/USD
The GBP/USD pair continues to hug the ascending trendline as bullish sentiment continues. Consecutive doji candles indicate indecision however buyers appear to have the edge in toady’s trading. The trading range between the 1.274- 1.295 price levels will likely remain intact. Momentum indicators remain in bullish territory.
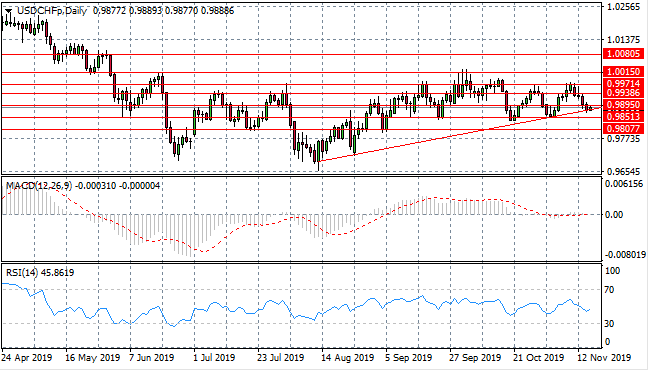
USD/CHF
The USD/CHF pair is testing the 0.989 support level as well as the ascending trendline. On each previous occasion that the pair has tested the ascending trendline, a bullish reversal has taken place. Momentum indicators are neutral if slightly bearish, with MACD bouncing along the zero line and RSI moving into the sell channel.
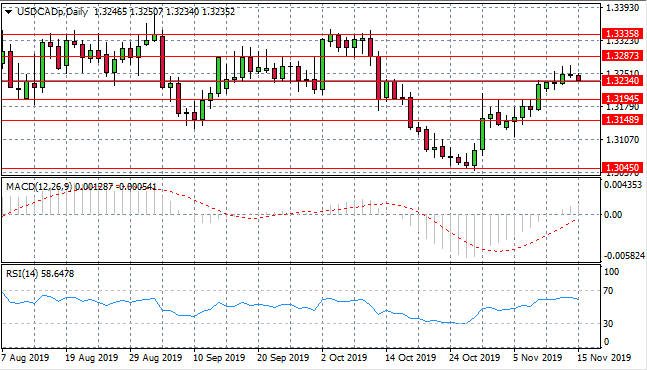
USD/CAD
The USD/CAD pair has broken the 1.323 resistance level after a sustained rally in the pair, as 7 of the last 9 trading sessions have been bullish. The break has resulted in a doji candle and the return of sellers to test the price level once again. Momentum indicators have upward trajectories, with MACD breaking the zero line to the upside and RSI approaching overbought conditions.
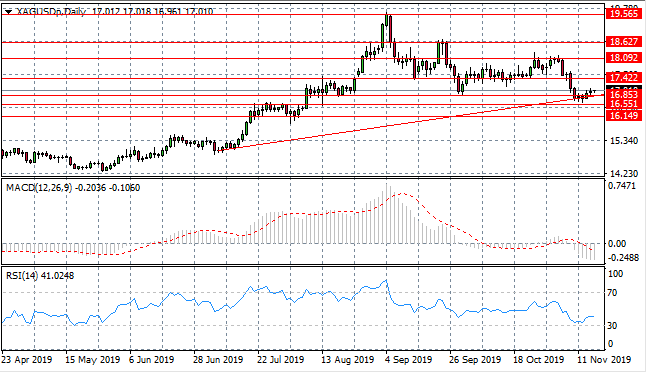
SILVER
Silver has broken several support levels with the bearish move decelerating when price action met the ascending trendline. The metal has now stalled at the 16.85 support level. The metal has oscillated within a tight trading range between the 16.85- 18.09 price levels in recent trading. Momentum indicators remain in bearish territory.
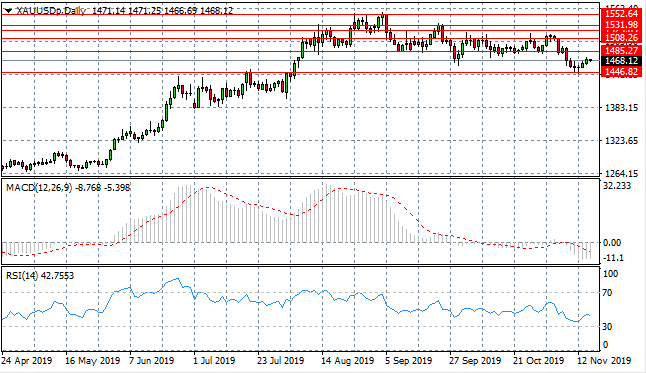
GOLD
Bearish momentum has reverted from the 1446.82 support level acts as the new obstacle for Gold sellers. Buyers have since returned and will likely drive price action back towards the 1485.27 resistance level. Momentum indicators have also reversed and recovering from oversold conditions.
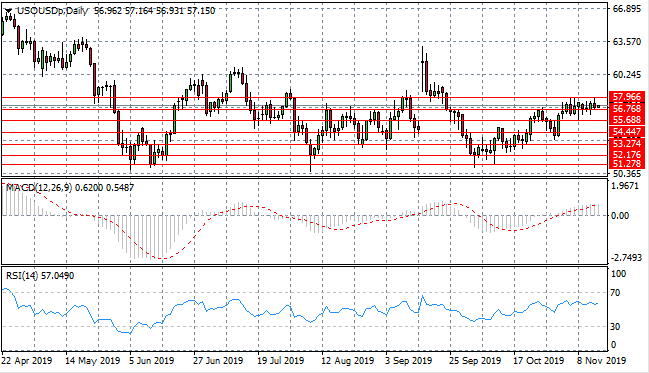
OIL
WTI price action has returned to test the 57.96 price level which represents a strong resistance area for the commodity. Price momentum appears to be building around the 56.76 support level as oscillations begin to tighten. A breakout generally occurs when this happens. Momentum indicators have flattened in bullish territory.