Sellers Dominate The USD/CAD Pair
- 2 Jun 2020
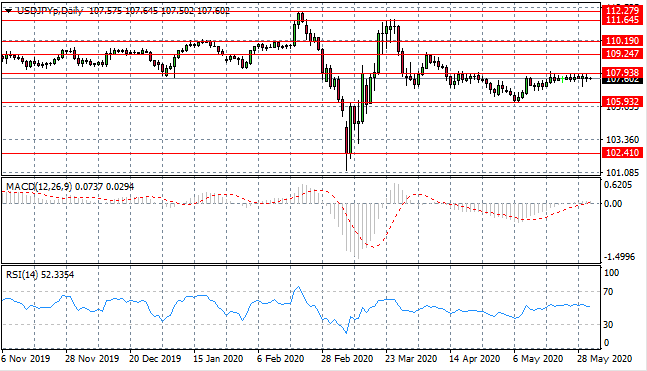
USD/JPY
The USD/JPY pair has failed to push beyond the 107.93 resistance level, where a series of doji candles have gathered, indicating a lack of conviction from buyers. The pair seems likely to take the previous horizontal price pattern in the near-term. Momentum indicators have stalled in neutral/bullish territory.
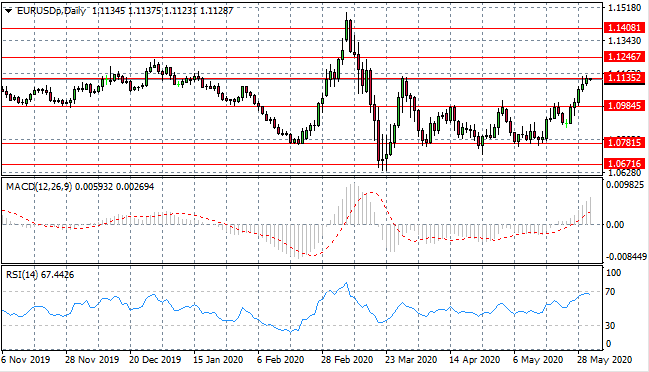
EUR/USD
The Eurodollar has moved to test the 1.113 resistance line, which represents a ceiling in a previous trading range. Selling pressure has risen into the rally which suggests that buyers are losing their dominance. Momentum indicators have turned bullish with RSI testing the overbought ’70’ line.
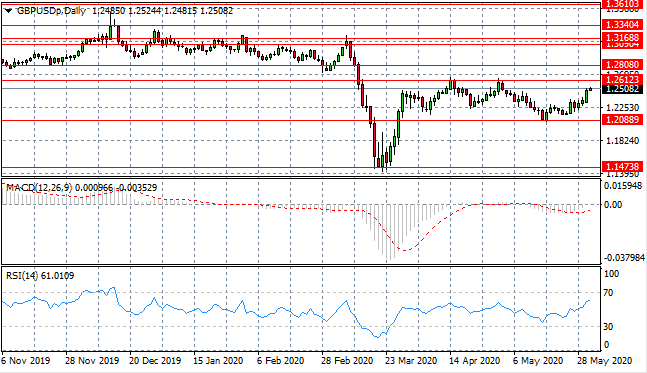
GBP/USD
The GBP/USD pair has moved towards the the 1.261 resistance level which has represented a previous obstacle for the pair. Going forward, the pair will likely continue to oscillate between the 1.208 and 1.261 price levels. Momentum indicators have upward trajectories.
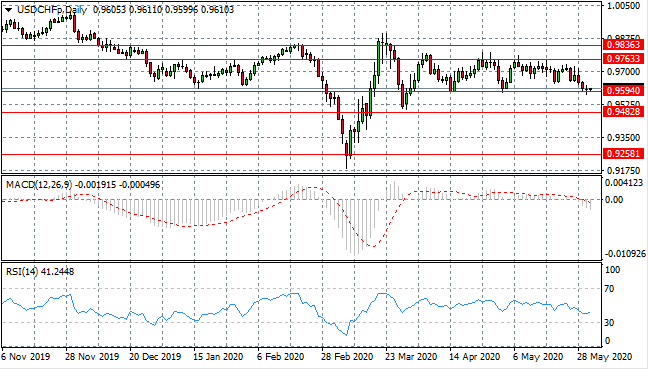
USD/CHF
The USD/CHF pair has returned to test the 0.959 support level as sentiment has turned bearish in recent trading. A stall has occurred at this price level where a doji candle indicates indecision. Therefore, sellers appear to have lost steam. Momentum indicators have flattened in bearish territory.
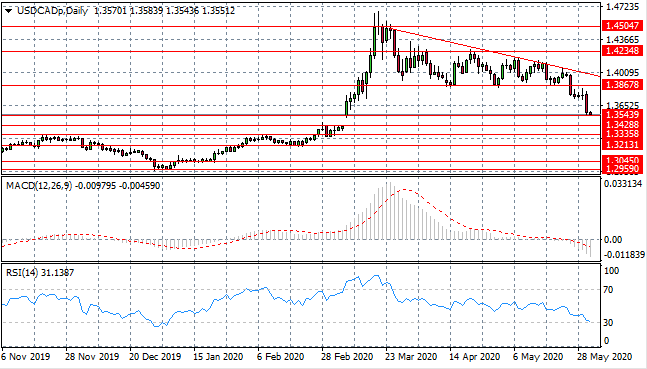
USD/CAD
The USD/CAD breakout is beginning to build momentum as oil price recovers. A test of the 1.354 support level may see price action return to previous levels seen before the Covid-19 breakout. Momentum indicators have downward trajectories, with RSI approaching the 30 oversold line.
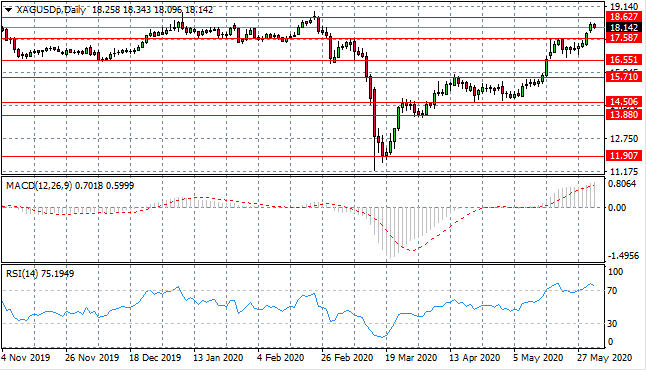
SILVER
Silver has pushed beyond the 17.58 resistance level which has represented an obstacle for the metal in the past. The next test is the 18.62 price level, yet sellers have returned in early trading. Momentum indicators are strongly bullish with RSI moving beyond the overbought line.
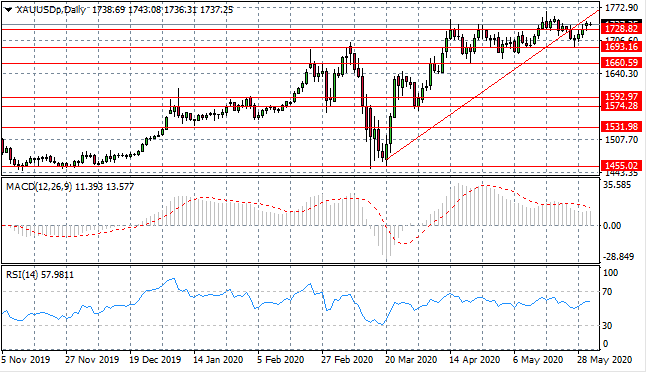
GOLD
Gold buyers are still in the game and have been inspired to return after price action touched the 1693.16 support level. A break of the 1728 price level indicates conviction from buyers with price action moving towards a test of the ascending trendline. Momentum indicators highlight further upside potential.
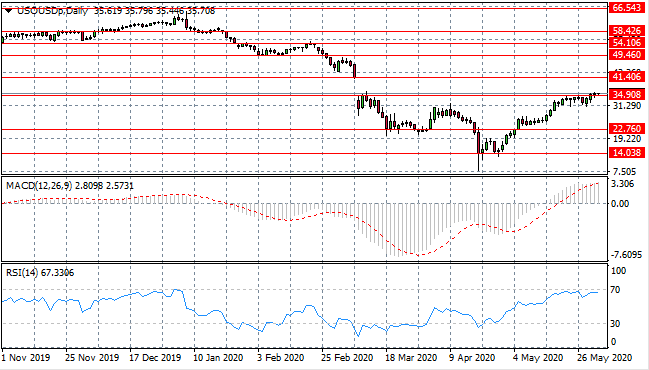
OIL
WTI appears to be struggling to move beyond the 34.90 resistance level, which if broken, would represent the return to pre-Covid-19 price levels. A break has still not materialised yet buyers appear to be active. Momentum indicators remain in bullish territory although RSI is testing overbought conditions.