US500 Breaks Key Resistance Line
- 16 Nov 2020
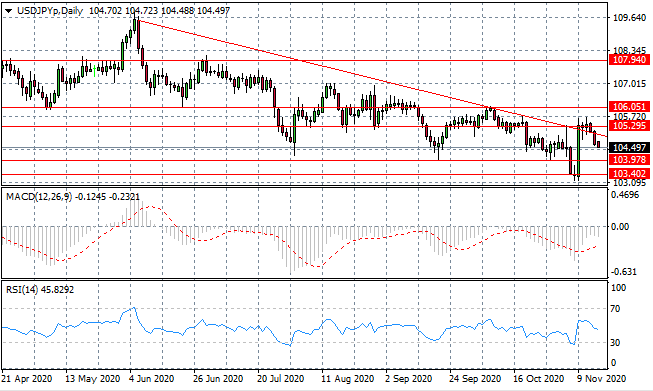
USD/JPY
USD/JPY sellers have returned and as a result, price action has broken the descending trendline to the downside. The next target is the 103.97 support level as the longer-term bearish move remains intact. Momentum indicators are bearish.
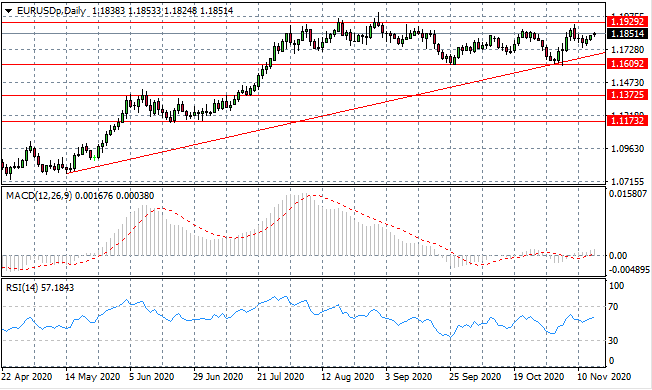
EUR/USD
The Eurodollar has found support and is moving back towards the range ceiling at the 1.192 price level. If the pair can break range the rally should gather significant momentum. Momentum indicators have upward trajectories with MACD breaking the zero line.
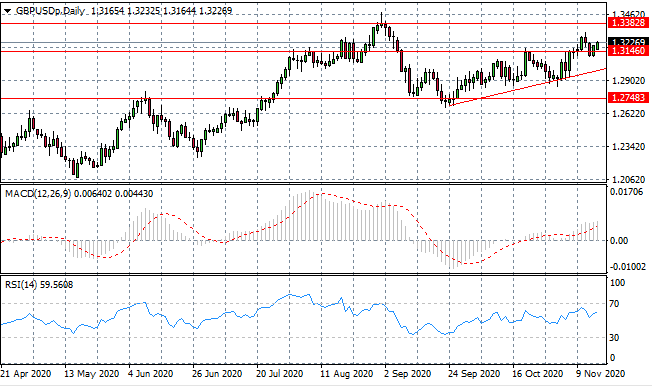
GBP/USD
The GBP/USD rally is continuing at a more moderate pace. Buyers appear to be influencing price action despite some selling activity. Given the current trajectory, we may expect another test of the 1.338 resistance line. Momentum indicators are bullish, with further upside potential.
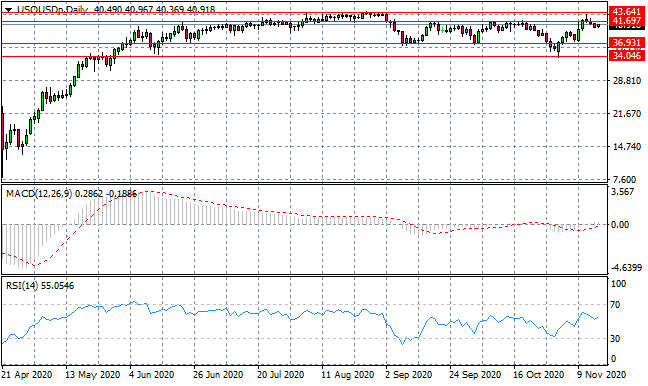
OIL
WTI is languishing at the $40 per barrel range as neither buyers nor sellers are dominating price action. The current range between the 36.93 and 41.69 price levels will likely remain intact. Momentum indicators suggest a bearish bias with a break of the default line on RSI and a break of the zero line on MACD.
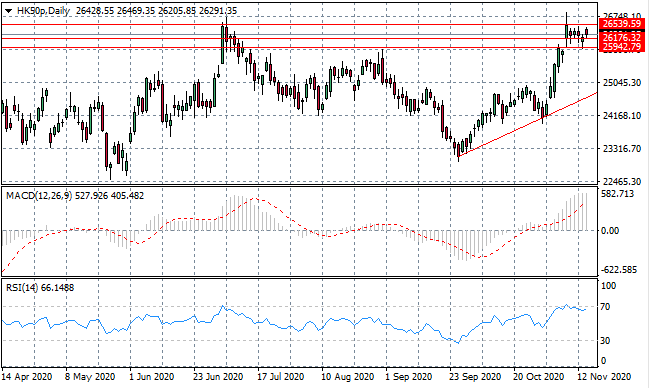
HK50
The HK50 has repeatedly stalled at the 26,176 indicating a lack of conviction from buyers and that a trend change may be on the cards. Momentum indicators have flattened in bullish territory with RSI testing the 70 overbought line.
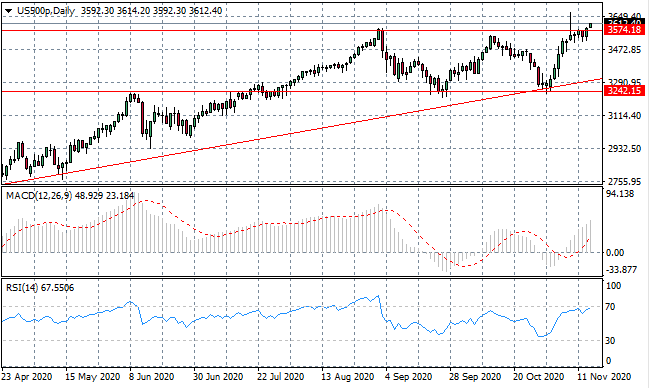
US500
The US500 has broken a recent price ceiling as buyers find momentum after a break in the rally. The next few trading sessions will determine whether the break can be sustained. It is a significant break as this range has been established since August and indicates strong appetite from buyers. Momentum indicators are bullish with RSI testing overbought conditions.
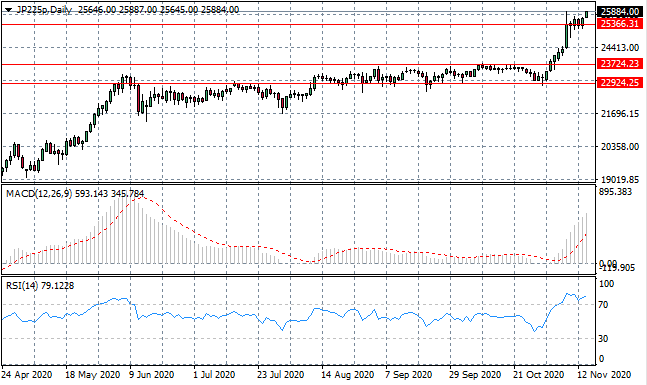
JP225
JP225 buyers have returned, taking the index beyond the 25,366 resistance line where price action had stalled. Is there enough bullish momentum to carry the rally? The answer will come in the next few trading sessions. Momentum indicators are bullish with RSI moving beyond the overbought line.