USD/CHF Rejects Key Resistance Area
- 30 Jul 2019
Kickstart your new year with the best USD50 bonus campaign. Limited-time offer! Get it now!
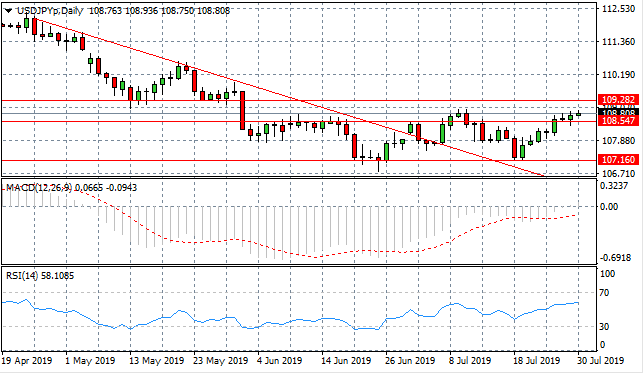
USD/JPY
The USD/JPY pair has bounced back from the 107.16 price level and has broken the 108.54 resistance line. The next price target for the rally is the 109.28 resistance line. Momentum indicators are bullish with MACD testing the zero line and RSI entering the bullish channel.
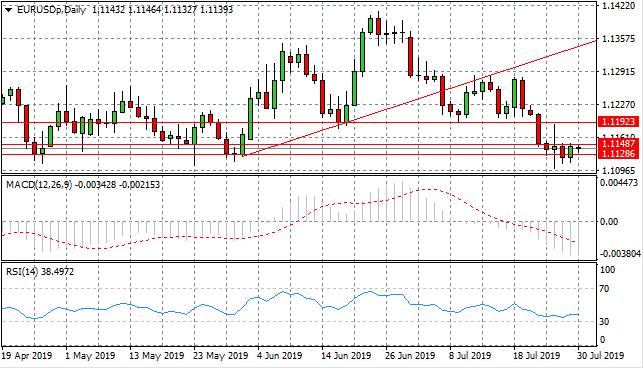
EUR/USD
EUR/USD is now testing the 1.112 price floor, which represents a key support area for the pair. Price action is now testing the 1.114 price level and a break may the signal of a return to the previous bullish trend. Momentum indicators highlight a slowdown in bearish sentiment which consolidates a potential reversal.
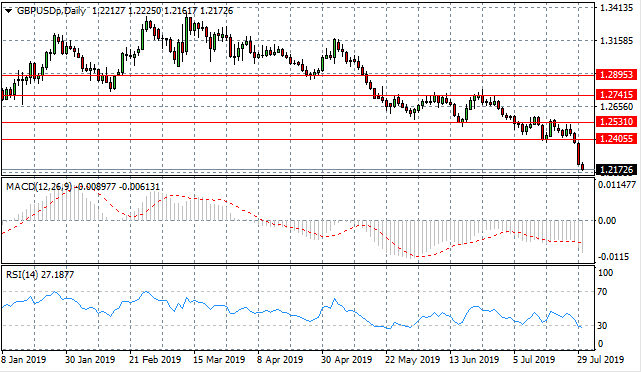
GBP/USD
The GBP/USD pair has broken the trading range between the 1.240 and the 1.253 price levels, representing a multi-year low. The break confirms a longer-term downtrend for the pair as the economy stalls and political uncertainty rises. Momentum indicators remain moderately bearish, approaching oversold conditions.

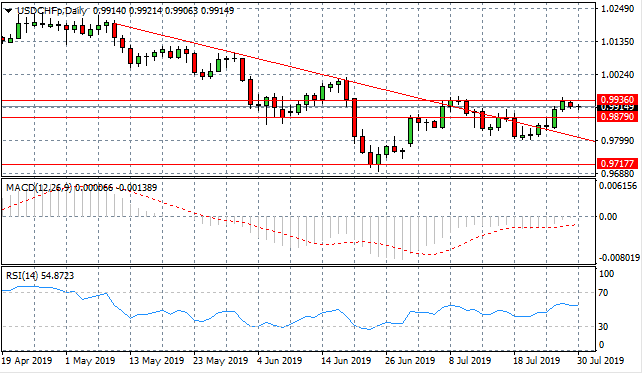
USD/CHF
The USD/CHF pair has broken the descending trendline and is now testing the 0.993 resistance line. The pair appears to be rejecting this resistance line currently as US Dollar buyers lack conviction. Momentum indicators are mixed with MACD flattening in bearish territory and RSI flattening in the bullish channel.
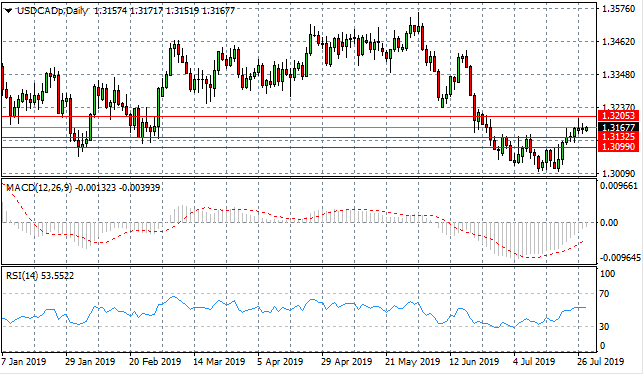
USD/CAD
The USD/CAD pair has touched the 1.320 resistance line which was subsequently rejected. Another attempt to approach the resistance line is underway. A break will mean the resumption of a previous trading range. Momentum indicators appear to be undergoing moderate recoveries, turning more bullish.
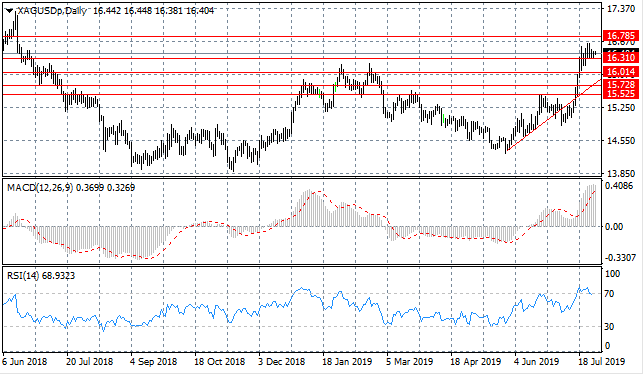
SILVER
Silver has moved beyond the 16.31 resistance line with the next obvious resistance line at the 16.78. As price climbs, the metal takes several stalls which may signal that buyers are losing strength. Momentum indicators look overbought with MACD flattening in strongly bullish territory and RSI moving back towards overbought conditions.
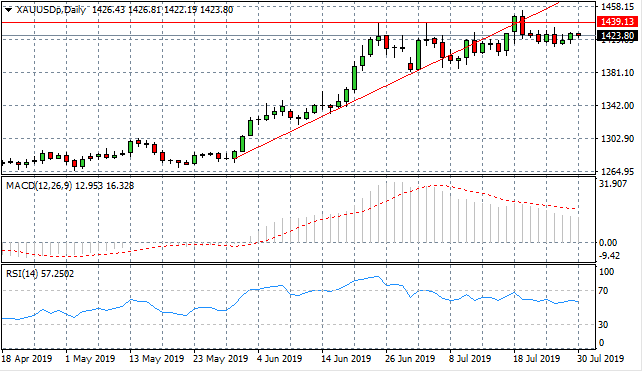
GOLD
Gold has rejected both the 1439.13 resistance line and the ascending trendline as sellers have returned. The momentum does not appear to be with sellers, however, as trading seems to be moving horizontally- denoted by a series of doji candles. Momentum indicators are also pulling back from overbought conditions in apparent bearish reversals.
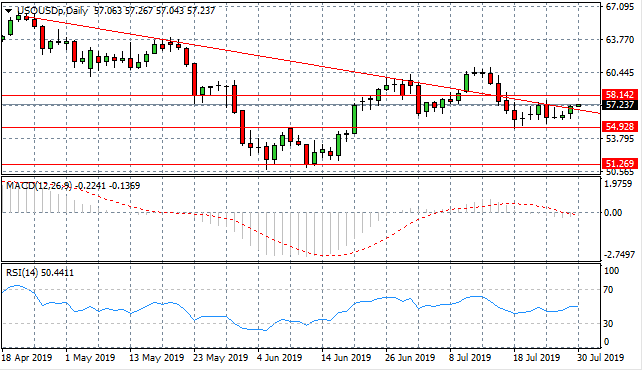
OIL
WTI is testing the descending trendline once again, as it re-establishes itself as a resistance area. A series of doji candles indicate that sentiment is not clear in one direction or another and is largely influenced day to day by geopolitical developments. Momentum indicators are mixed, with MACD breaking the zero line to the downside and RSI flattening at the default line.
Follow Us on Facebook:
