USDCHF Breaks Long-term Trading Range
- 24 Feb 2021
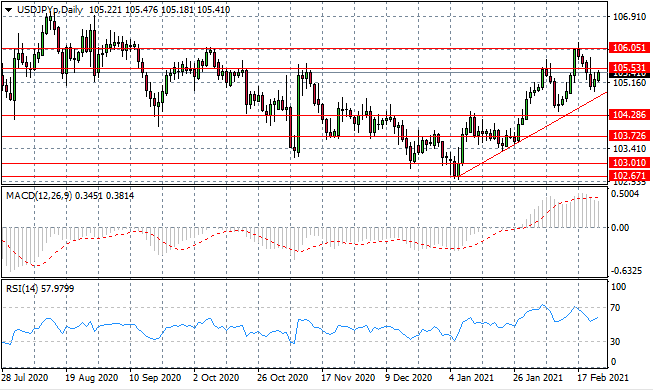
USD/JPY
The USD/JPY pair has found support and is once again heading back towards the 105.53 resistance line. A rally has begun to unfold in the last few months with sharp oscillations during the uptrend. Momentum indicators have stalled in bullish territory.
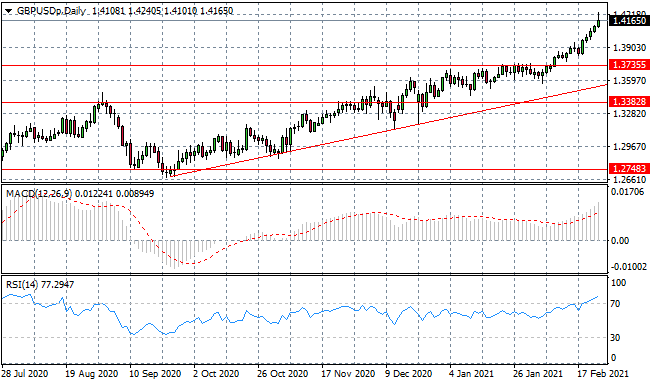
GBP/USD
The GBPUSD rally is showing the first sign of wavering bullish momentum as the current trading session signals rising selling pressure. The pace of the rally has climbed significantly since the end of January and a stall may be on the cards. Momentum indicators are bullish with RSI moving beyond the overbought line.
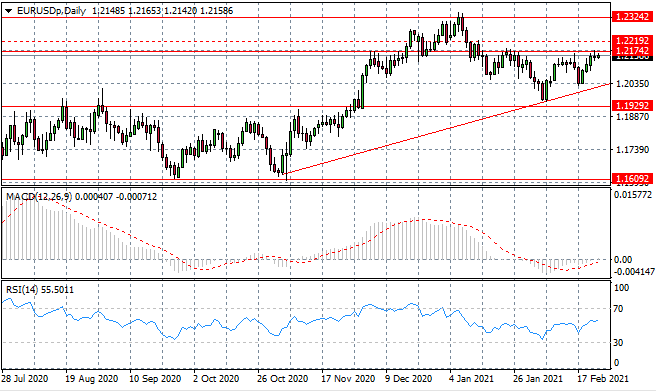
EURUSD
The Eurodollar has moved to test the 1.217 resistance line and several small-bodied candles indicate a lack of conviction from buyers. The resistance area also represents the upper bound of an ascending triangle. Momentum indicators are bullish with MACD testing the zero line.
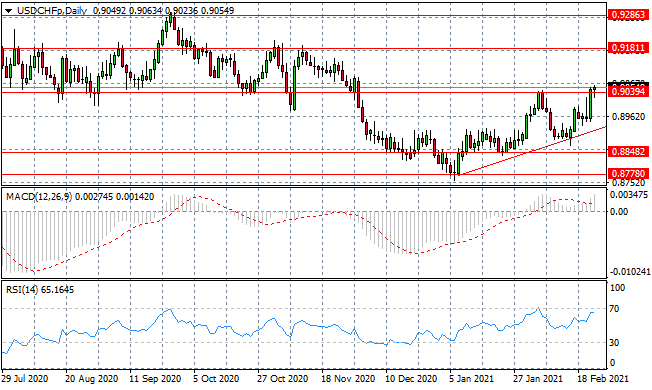
USDCHF
The USDCHF pair has broken the 0.903 resistance line indicating the break of the current trading range. Considering this range has been established since November 2020, the break indicates significant bullish conviction. Momentum indicators remain in bearish territory.
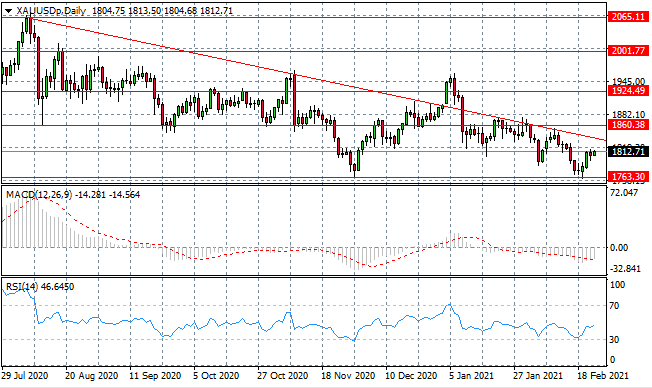
XAUUSD
XAUUSD is once again approaching the descending trendline as buyers returned at the 1763 support area. The descending trendline has contained rally attempts since August 2020. Momentum indicators are undergoing reversals.
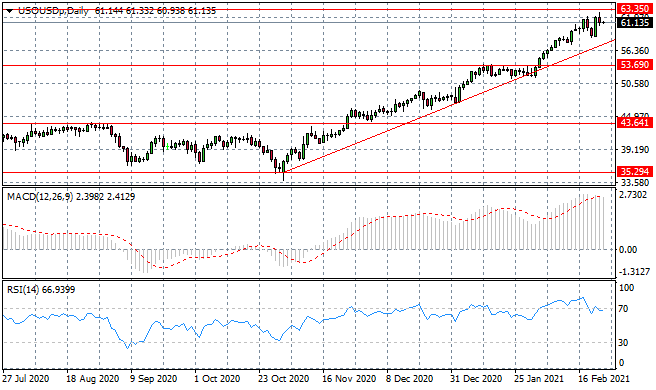
USOUSD
The USOUSD has failed to hit the 63.35 target as sellers returned in yesterday’s trading session. Any pullbacks in the rally are typically followed by a spike in buying activity and it is a pattern that seems likely to continue, even as the commodity approaches the resistance line. Momentum indicators are reversing, with RSI breaking below the overbought line.
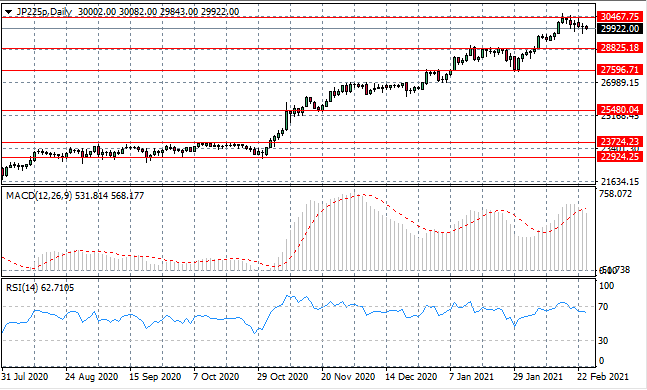
JP255
The JP255 has reversed at the 30,467 resistance line as a bearish bias starts to inform price action for the index. Conviction from sellers remains low as indicated by the doji/small-bodied candlesticks after the break. Momentum indicators have downward trajectories.