Will The Dollaryen Continue To Move Lower?
- 14 May 2020
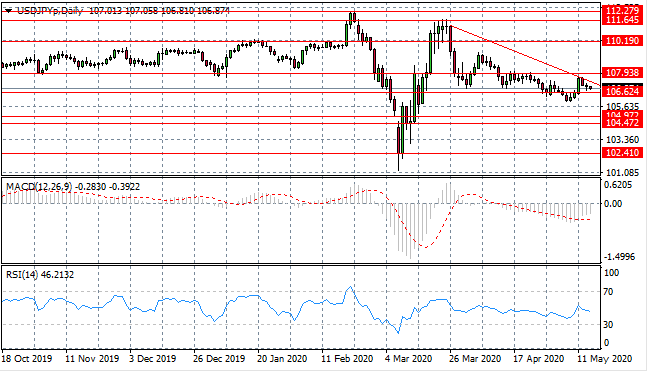
USD/JPY
The USD/JPY pair is heading back towards the 106.62 price level, after failing at the descending trendline. The pullback confirms a longer-term bearish bias and the development of a descending triangle pattern hints at prices moving lower. Momentum indicators remain in bearish territory.
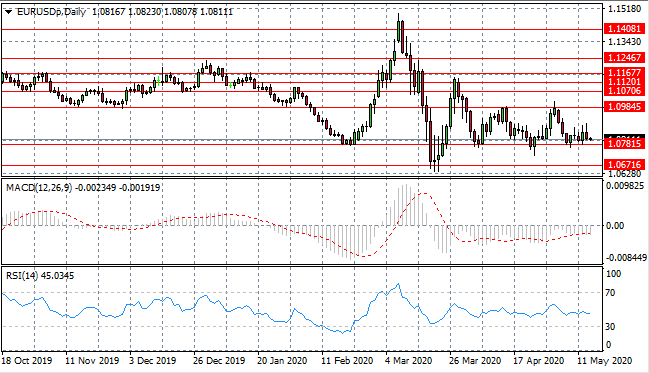
EUR/USD
The Eurodollar has reverted back to the 1.078 support line where a bullish rebound generally takes place at this price level. The pair seems likely to oscillate between the 1.078 and 1.098 price levels in the near-term. Momentum indicators are neutral if slightly bearish.
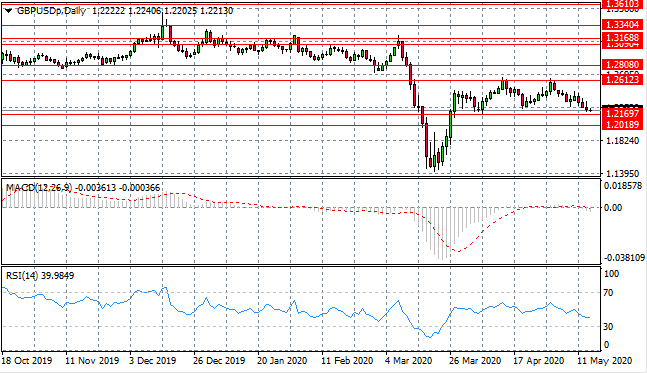
GBP/USD
The GBP/USD pair may be establishing a new trading range with price action, once again, heading back towards the price floor at the 1.216 support level. The pair will likely oscillate between the 1.216 and 1.261 price levels in the near-term. Momentum indicators have moved into bearish territory.
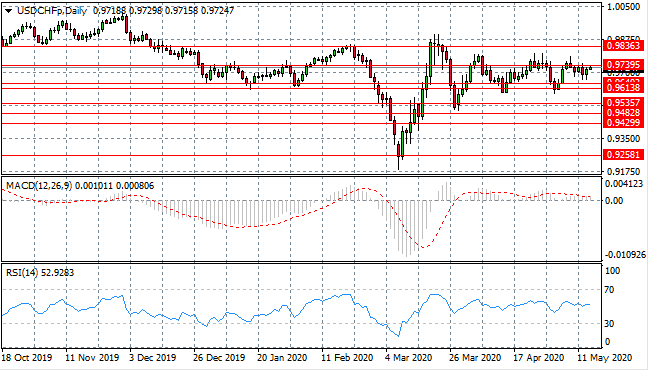
USD/CHF
The USD/CHF pair has failed several times at the 0.973 price level. Each pullback results in another test of the resistance area and it seems likely that the pair will continue to move within the 0.961- 0.973 trading range. Momentum indicators are languishing in neutral territory.
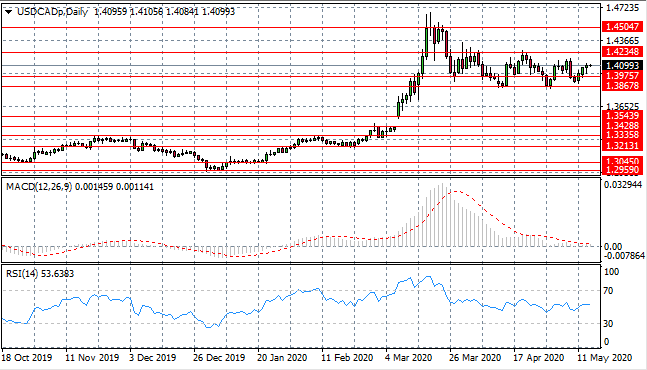
USD/CAD
The USD/CAD pair has broken the 1.397 price line to the upside and the next target is the 1.423 resistance area. However, each bullish move is met with the return of sellers to drive price action back to the support level at 1.386. Momentum indicators are neutral.
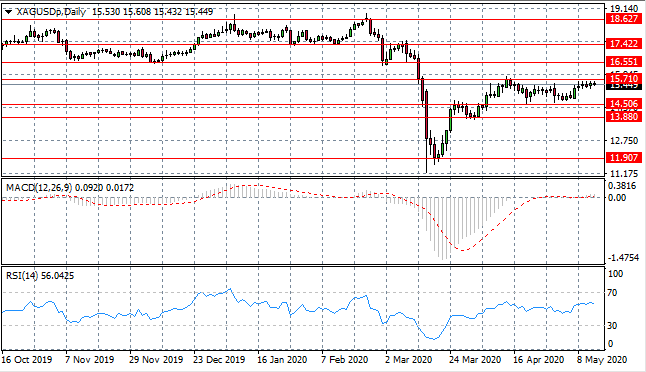
SILVER
A Silver rally has taken the metal back towards the 15.71 resistance area which represents an obstacle to buyers. On previous occasions, tests of this price level have resulted in a pullback. Momentum indicators have also flattened in bearish/neutral territory indicating the end of the bullish run.
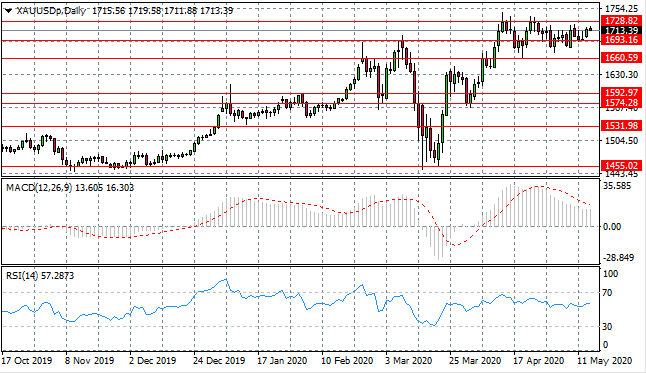
GOLD
Gold has begun to trade in a new range between the 1693 and 1728 price levels. The metal has hugged the 1693 price level in recent trading, moving horizontally. Longer-term, price action shows that an uptrend has been established, yet momentum indicators have flattened.
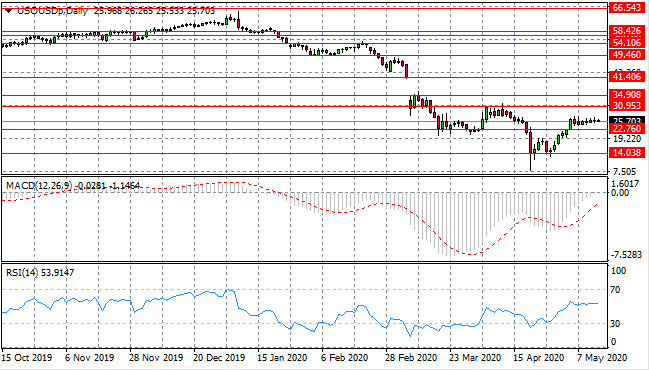
OIL
WTI has finally pushed beyond the 22.76 resistance line yet momentum has stalled as denoted by a series of small-bodied candles. A target exists at the 30.95 resistance area, yet the current trading range will likely remain intact in the near-term. Momentum indicators remain bullish.