WS30 Tests Key Support Level
- 8 Sep 2021
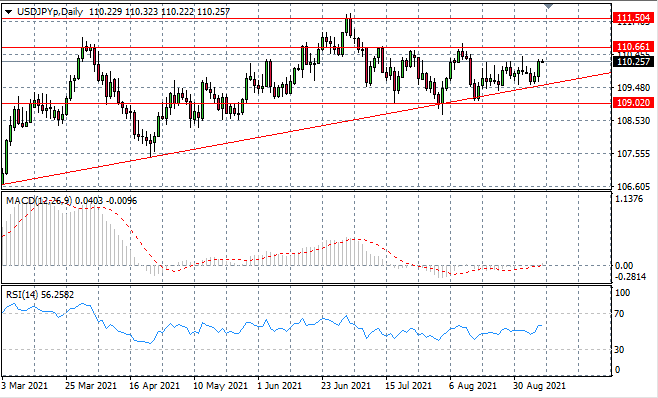
USD/JPY
The USDJPY pair has rebounded from the ascending trendline as bullish sentiment has begun to rise in the pair. Bearish sentiment has been a theme in recent trading yet the longer-term trajectory remains bullish. A rise in buying activity in yesterday’s trading has taken price action back towards the 110.66 resistance line. Momentum indicators have flattened in neutral territory.
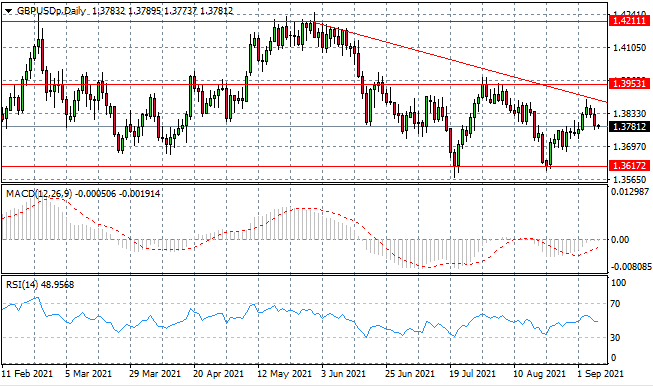
GBP/USD
The GBPUSD has once again, been influenced by selling pressure. Price action came close to, but failed to test the trendline which has so far contained any rally attempts. Oscillations are likely to narrow within the current range with the trendline acting as a resistance line. Momentum indicators remain in neutral territory.
EURUSD
The Eurodollar has rebounded from the 1.188 resistance level and descending trendline. Rising bearish activity in yesterday’s trading indicates that sentiment has shifted and the rally has broken down. The pair will likely trade in range in the near-term. Momentum indicators are bullish.

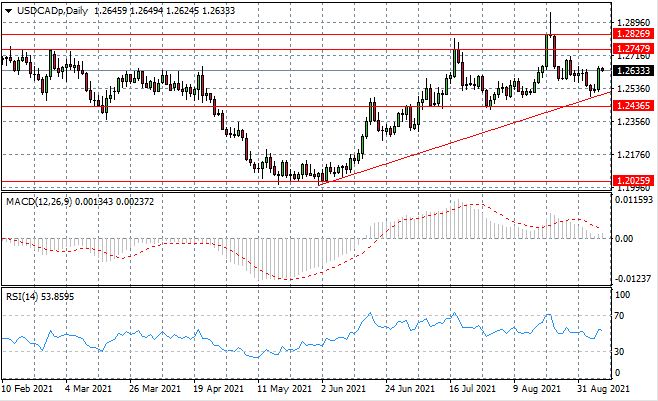
USDCAD
A bullish rebound for USDCAD pair confirmed longer-term bullish sentiment. The ascending trendline continues to act as a support level for the pair. Buyers will therefore have the 1.274 resistance line in sight, which represents the upper bound of the current range. Momentum indicators have downward trajectories.
XAUUSD
The XAUUSD has stalled at the 1795 support line after a sharp rise in bearish activity in yesterday’s trading. The support line represents a narrower consolidation channel. The 1831 resistance line represents the upper bound of the channel and key obstacle to recent rallies. Momentum indicators remain in bullish territory.

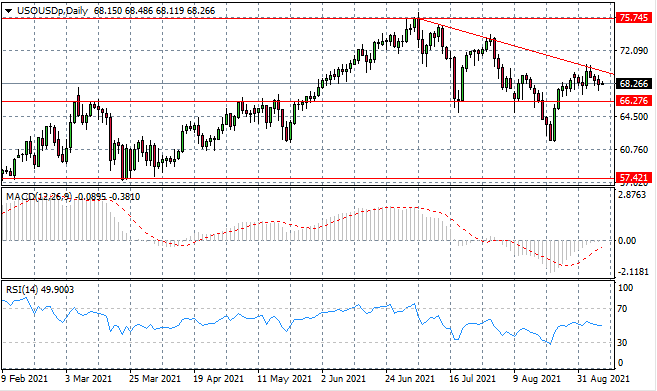
USOUSD
The USOUSD will continue its downward trajectory and a series of small-bodied candles indicate that sentiment remains weak despite the bearish bias. Price action will likely be contained by the 66.27 support line. Momentum indicators have bullish trajectories.
WS30
The WS30 has pulled back to the ascending trendline where typically bullish rebounds take place. Price action has also been contained by a price ceiling at the 25,576 price line and therefore significant bullish momentum will be required to facilitate a break. Momentum indicators remain bearish.

