An Mid-Week Oil Price Reversal
- 2 Dec 2020
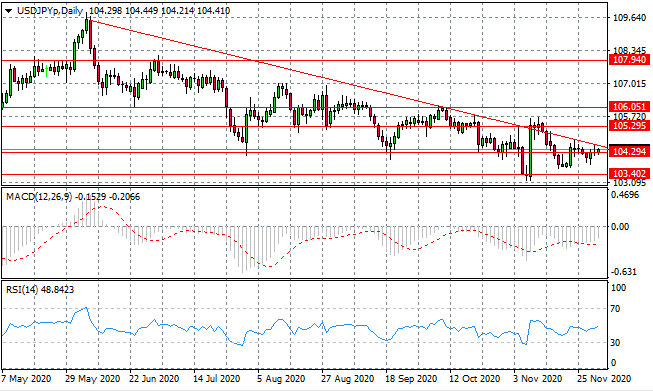
USD/JPY
The USD/JPY pair is testing the descending trendline once again and previous tests have resulted in a retracement. Looking at the candlestick patterns, it is clear that dollar buyers lack conviction, which has been the theme since May. Bearish sentiment seems likely to continue. Momentum indicators have moderate upward trajectories.
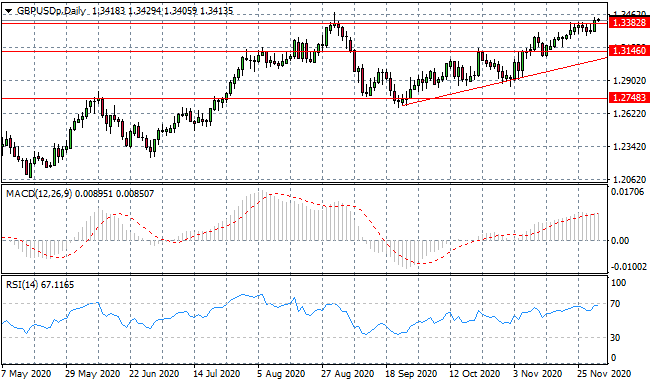
GBP/USD
GBP/USD buyers have returned with strong conviction driving the break of the 1.338 resistance line. How much further the move can go will likely be determined by the persistent weakness of the Dollar rather than Pound strength. Momentum indicators are bullish with RSI testing the 70 resistance line.
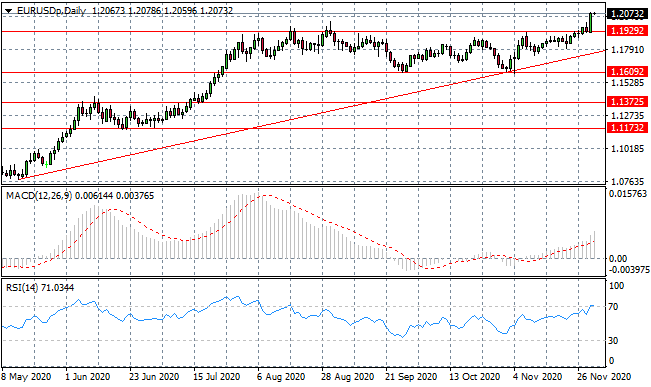
EURUSD
The Eurodollar has surged passed the 1.192 resistance line and has reached news highs. This irrational exuberance seems unlikely to continue and may be dampened by moves from the ECB later in the month. Momentum indicators have upward trajectories, yet RSI is testing overbought conditions.
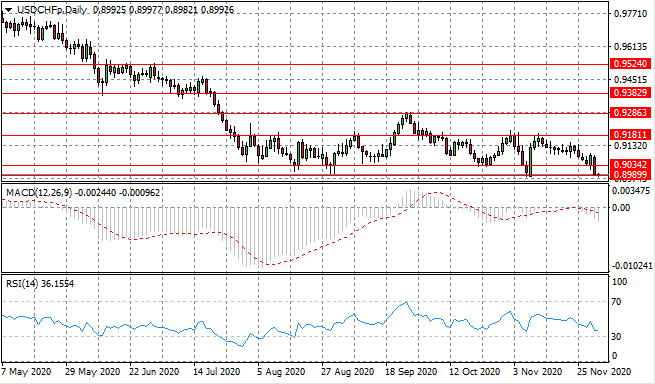
USDCHF
The USDCHF pair has struggled to move out of the 0.903 price zone and yesterday’s trading once again saw a trade off in the US dollar. The next move in the pair will be pivotal for the long-term price trajectory. On the previous occasion that price reached this level a bullish rebound followed. Momentum indicators are bearish.
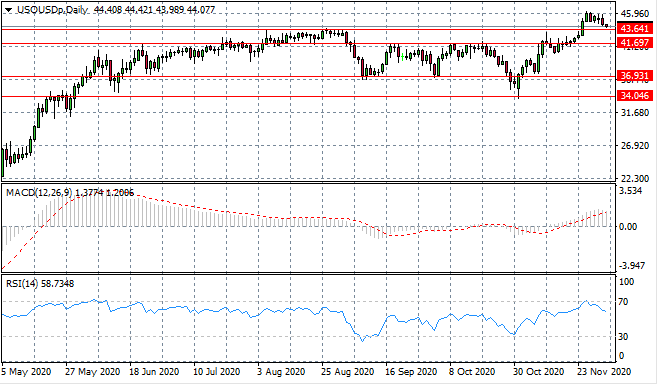
USOUSD
The USOUSD has begun its return back towards the 43.64 price level, as the most recent bullish run appears to have come to an end. A break of the price level will see the commodity return to a consolidation channel and a price level that is unsustainable for many oil suppliers. Momentum indicators have begun downward trajectories.
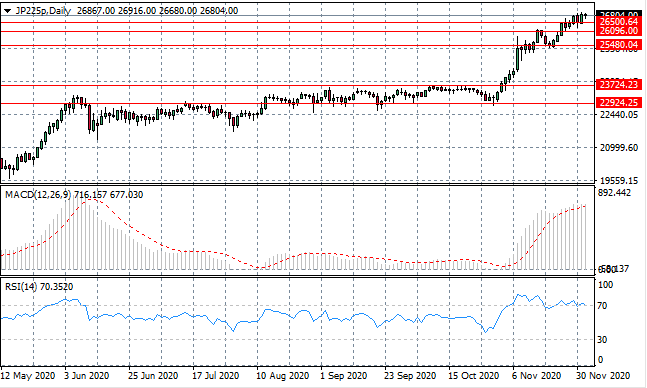
JP225
The JP225 has climbed, once again, to new recent highs. The break of the 26,500 price area shows significant conviction from buyers despite a tussle in recent trading. Can we therefore expect the sharp uptrend to continue? The rally has had periods of rest in the uptrend such as at the 23,000 price level and we may see this pattern repeated. Momentum indicators have flattened in bullish territory with RSI testing the 70 resistance line.