Are Gold Buyers Just Taking A Rest?
- 8 May 2020
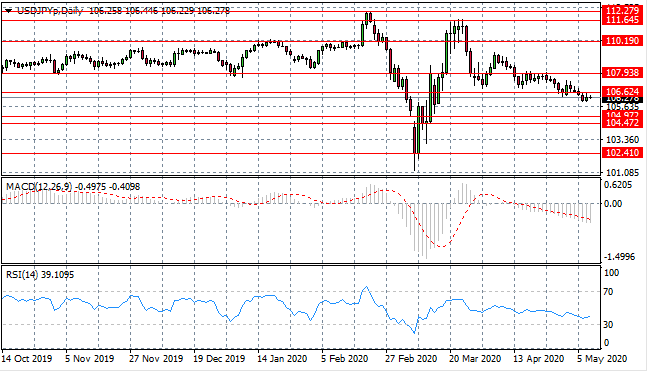
USD/JPY
The USD/JPY pair has moved to break the 106.62 support level as sellers begin to dominate price action. Despite the break, price action remains subdued as sellers fail to dominate. Momentum indicators have turned bearish and are approaching oversold conditions.
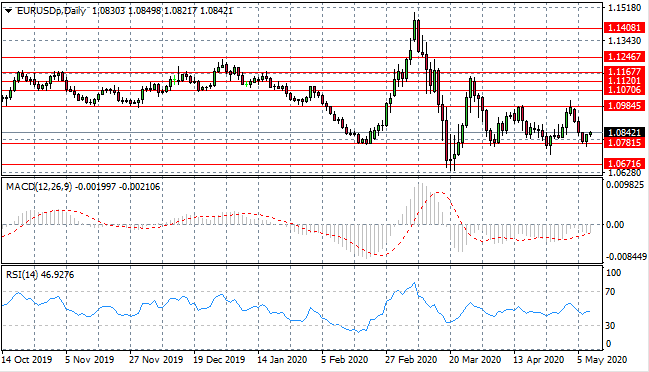
EUR/USD
The Eurodollar is having a revival at the 1.078 support level, where buyers have returned after the sell-off. The pair seems likely to oscillate between the 1.078 and 1.098 price levels in the near-term. Momentum indicators are mixed; with MACD heading towards the zero line and RSI remaining neutral.
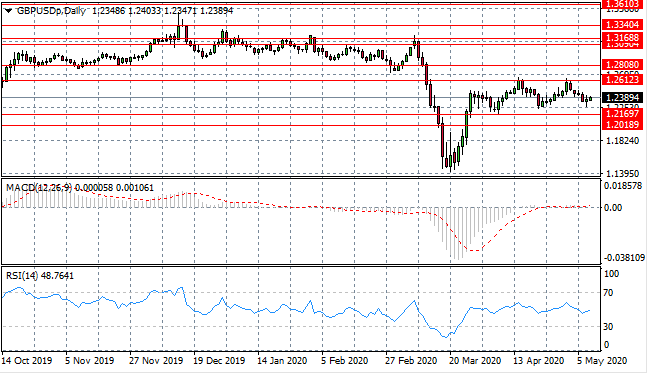
GBP/USD
The GBP/USD pair may be establishing a new trading range as the 1.261 resistance line represents a recent price ceiling. The pair will likely oscillate between the 1.216 and 1.261 price levels in the near-term. Momentum indicators have flattened in neutral/bearish territory.
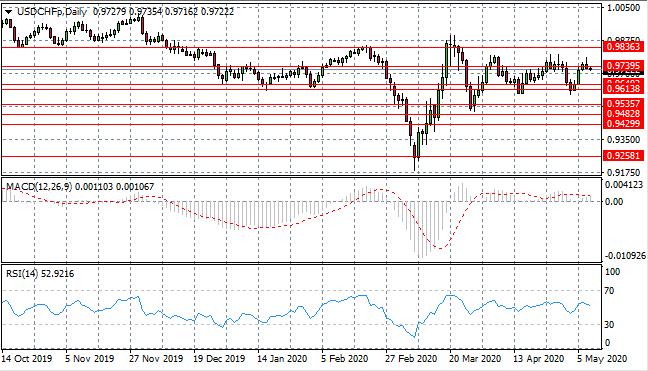
USD/CHF
The USD/CHF pair has failed several times at the 0.973 price level, despite pushing price action towards this resistance area. A pullback seems likely as the 0.961- 0.973 trading range remains intact. Momentum indicators are languishing in neutral territory.
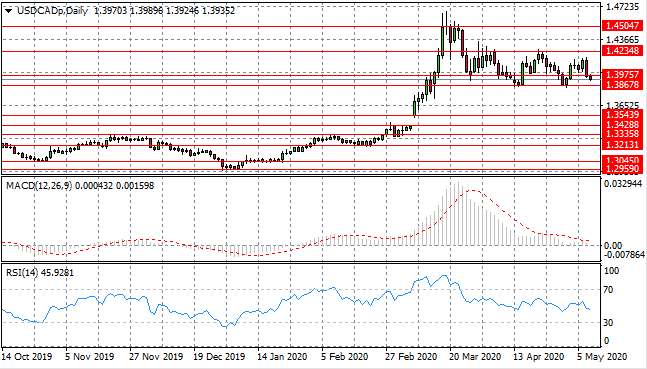
USD/CAD
The USD/CAD pair fails to clear the 1.397 support level for any extended period of time in recent trading. Each bullish move is cancelled out with the return of sellers to drive price action back to the support level. Momentum indicators have returned to neutral territory.
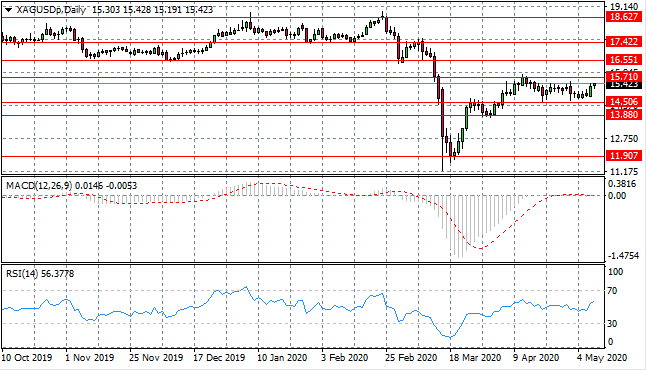
SILVER
A Silver rally has taken the metal back towards the 15.71 resistance area which represents an obstacle to buyers. On previous occasions, tests of this price level have resulted in pullback. Momentum indicators suggest that there is a moderate bullish bias yet both MACD and RSI remain in neutral territory.
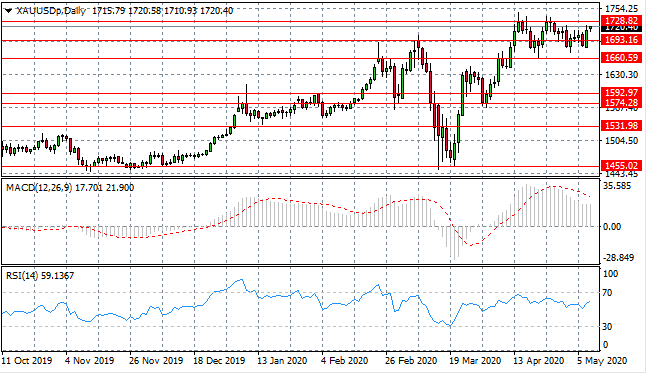
GOLD
Gold has begun to trade in a new range between the 1660 and 1728 price levels. A rally is underway as buyers tend to return at the 1693 price level. Whether the pair is able to push beyond the 1728 resistance area remains to be seen. Longer-term, price action shows that an uptrend has been established.
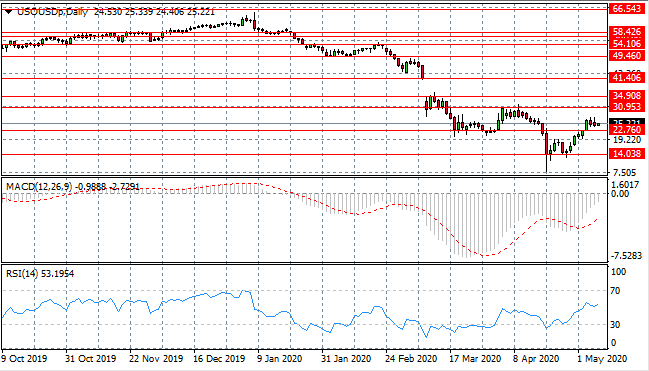
OIL
WTI has finally pushed beyond the 22.76 resistance line as buyers appear to be building momentum. A target exists at the 30.95 resistance area. Yet, again, the break has failed to produce any real bullish momentum with selling pressure rising and small-bodied candle representing indecision. Momentum indicators support the bullish bias.