Bearish Breakout For Eurodollar
- 17 Dec 2018
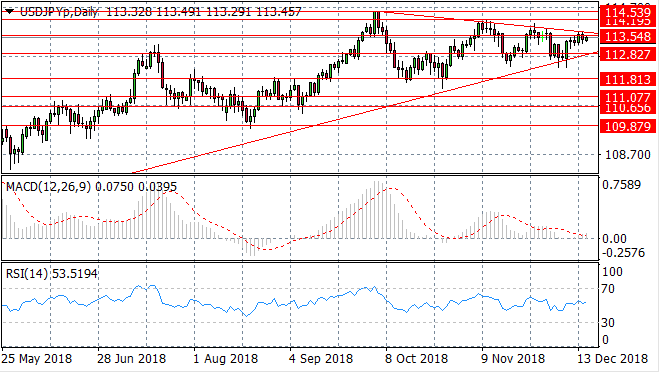
USD/JPY
The USD/JPY pair has entered into a symmetrical triangle pattern and is now approaching the upper trendline of the pattern, as buyers return to the pair. The pair is yet to reach the apex of the triangle at which point a breakout is expected. Momentum indicators are mixed with MACD approaching the zero line and RSI is neutral.
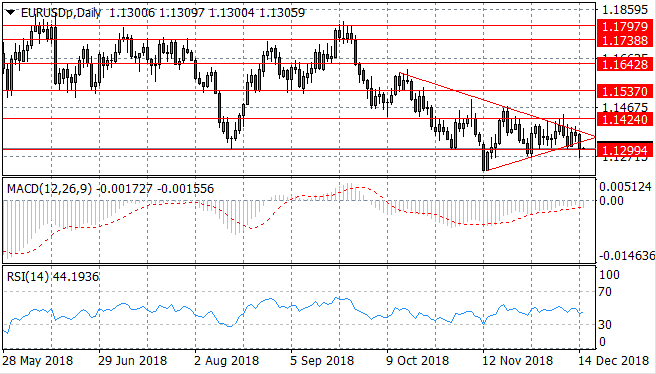
EUR/USD
The EUR/USD pair has broken out of a symmetrical triangle pattern, as a result of recent selling pressure. The pair is also testing the 1.129 rice level which remains a strong support area. Momentum indicators are neutral/bearish indicating there is currently little conviction from sellers.
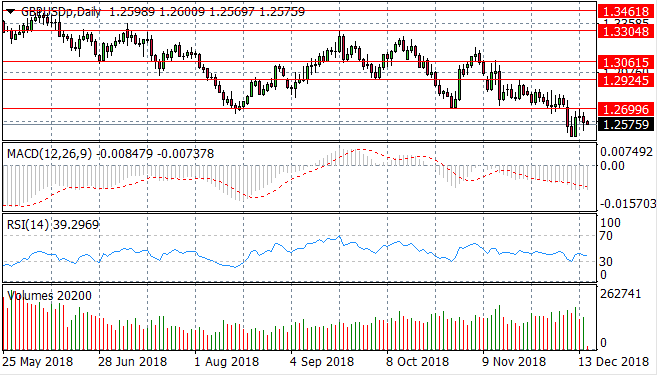
GBP/USD
The GBP/USD pair has made a strong recovery after reaching a new price low. Now the pair is heading back towards the 1.269 price level which represents a previous price floor. Momentum indicators remain bearish; with MACD extending below the zero line and RSI stalling just above the 30 support level.
USD/CHF
The USD/CHF pair has bounced back from the 0.986 price level and is now testing the 0.997 resistance level. It remains to be seen whether a new trading range may develop between these two price levels or between the 0.997 and 1.008 price levels. Momentum indicators appear to be turning more bullish as RSI begins a sharp upward trajectory.

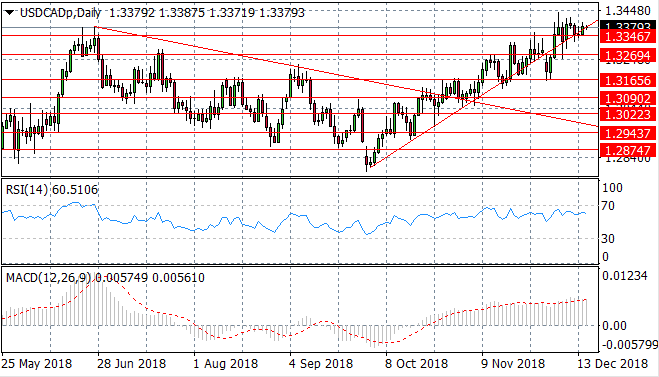
USD/CAD
The USD/CAD pair continues to test the ascending trendline and the 1.334 price level which represents a previous price high. Price action is yet to break these two levels in a meaningful way. Momentum indicators remain bullish; with MACD extending its position into bullish territory and RSI stalling just beneath the 70 resistance level.
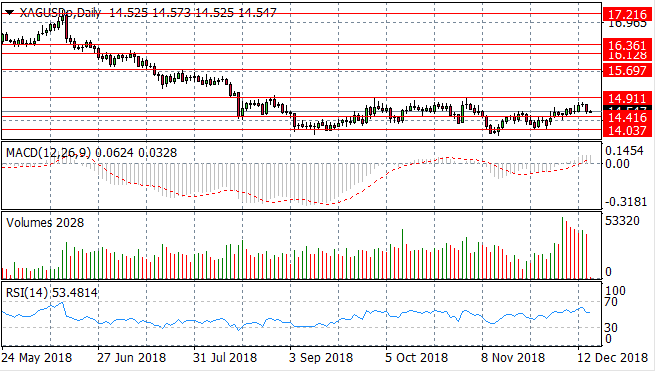
SILVER
Silver has once again stalled before reaching the 14.91 price level sending price action back to the 14.41 support level. The recent trading range between the 14.03 and 14.91 price levels remains intact. Buyers have returned to the metal to break the 14.41 price level. Momentum indicators have turned bullish with MACD breaking the zero line and RSI approaching the 70 resistance line.
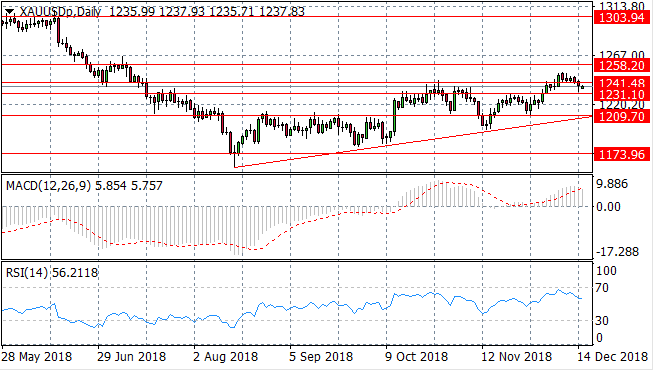
GOLD
Gold has broken the 1241.48 price level and is approaching the next support area for the metal at the 1231.10 price level. Momentum indicators are reversing from a bullish position with both MACD and RSI beginning to assume a downward trajectory.
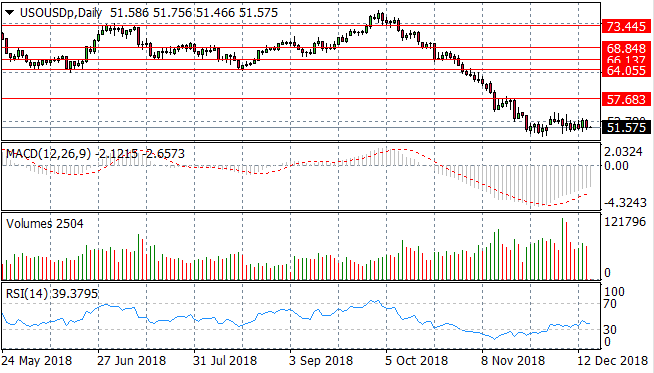
OIL
Oil has made a mild recovery after an extended sell-off and now appears to be consolidating with a string of doji candles. Both sellers and buyers appear to be active. Momentum indicators are beginning a bullish momentum reversal.