Bullish Breakout For USD/CAD?
- 25 Mar 2019
Kickstart your new year with the best USD50 bonus campaign. Limited-time offer! Get it now!
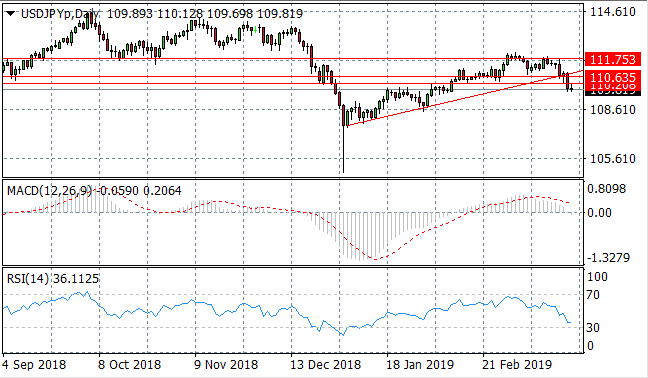
USD/JPY
The USD/JPY pair has suffered a pullback in price action breaking several support levels including the 110.20 price level and a descending trendline which may mark the beginning of a period of weakness for the US Dollar. Momentum indicators support bearish sentiment with MACD breaking the zero line and RSI resuming a sharp downward trajectory.
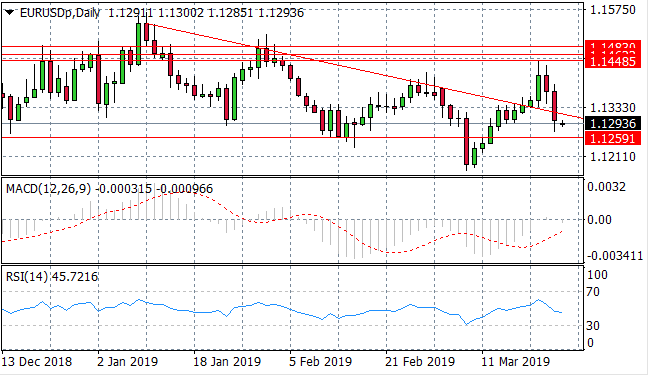
EUR/USD
The EUR/USD pair has made a complete reversal off the back of poor fundamentals data. A bearish break of the descending trendline could send price action back towards the 1.125 price level. RSI has begun a sharp downward trajectory.
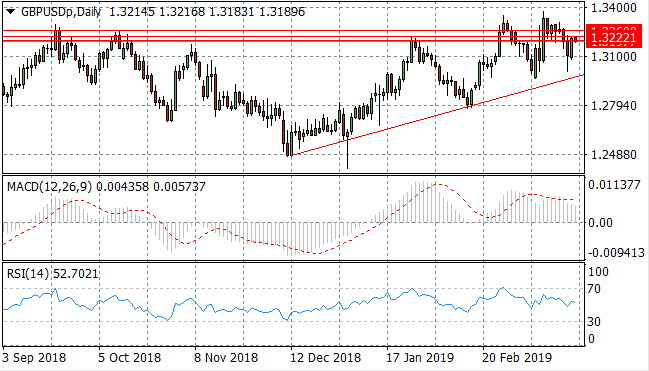
GBP/USD
The GBP/USD pair has returned to test the 1.319 price level which may only represent a pullback in the longer-term uptrend. Already buyers appear to have returned. Momentum indicators have a more bearish trajectory and are pulling back from bullish positions.

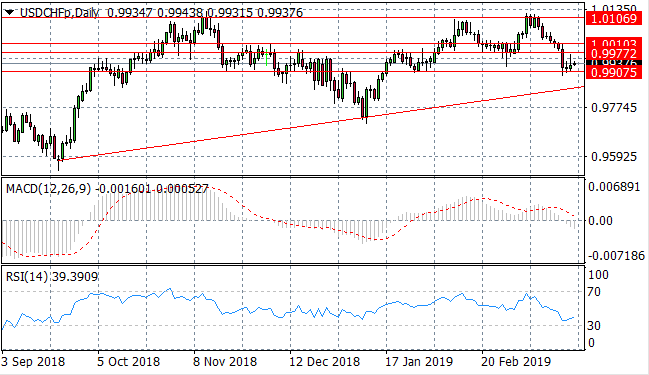
USD/CHF
The USD/CHF pair has broken a series of support levels, as the dollar suffered against the Swiss Franc. However, buyers have begun to return and price action is moving away from the 0.990 price level. Momentum indicators are mixed; MACD has broken the zero line and RSI is beginning a bullish reversal.
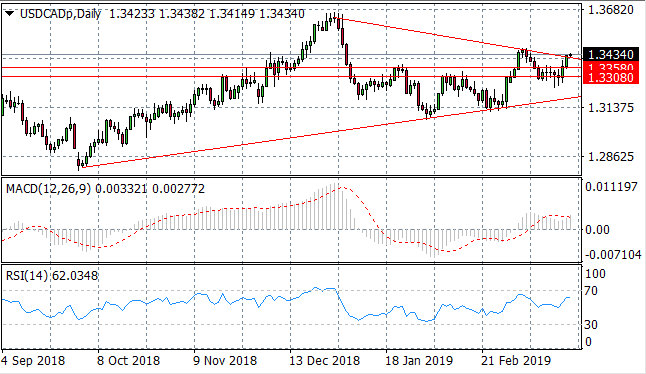
USD/CAD
The USD/CAD pair has broken the 1.335 price level as well as a descending trendline. A break would prove significant as this trendline has been acting as a resistance area for the pair. Momentum indicators remain moderately bullish.
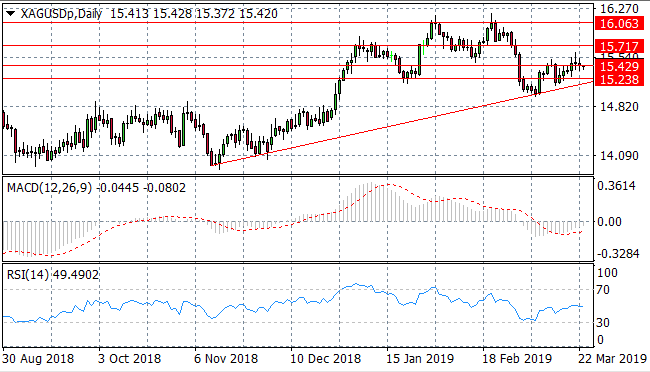
SILVER
Silver has been unable to move beyond the 15.42 price level which may result in the metal oscillating between this resistance level and the ascending trendline. Momentum indicators have turned bullish with MACD approaching the zero line and RSI beginning an upward trajectory.
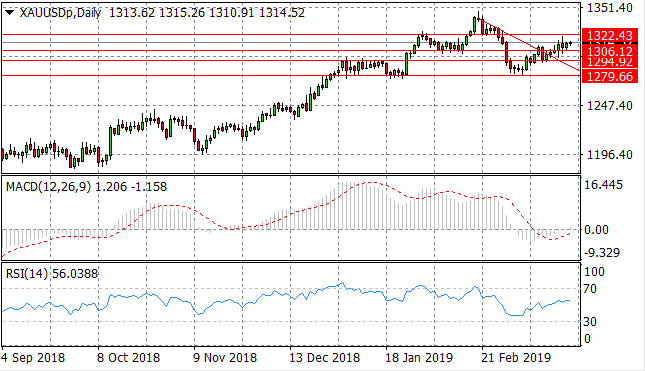
GOLD
Gold buyers appear to be dominating price action with a break of both the descending trendline and a support level at the 1306.12 price line. Momentum indicators support bullish sentiment with reversals underway on both MACD and RSI.
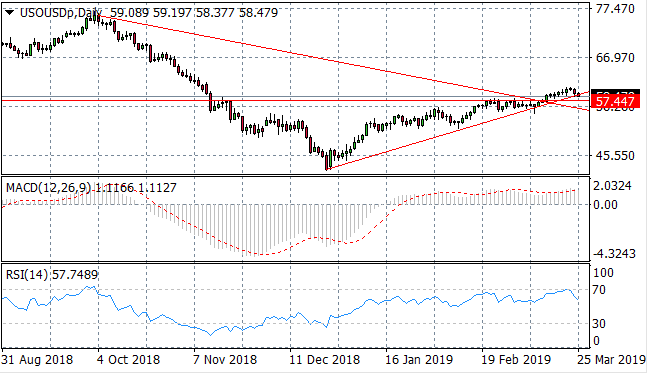
OIL
WTI buyers dominance was short-lived with price action now pulling back to test the ascending trendline. A break would send oil back to a key resistance area around $57 per barrel. RSI has also pulled back from the overbought 70 resistance line and MACD is flat in bullish territory.
Follow Us on Facebook:
