USD/CHF Held Up At Key Support Level
- 26 Mar 2019
Kickstart your new year with the best USD50 bonus campaign. Limited-time offer! Get it now!
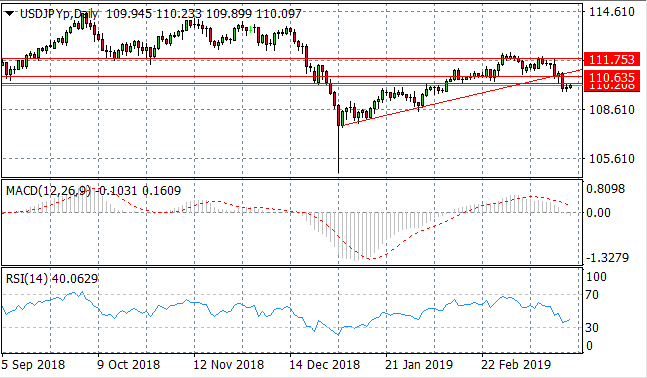
USD/JPY
The USD/JPY pair has suffered a pullback in price action breaking several support levels including the 110.20 price level and an ascending trendline which may mark the beginning of a period of weakness for the US Dollar. Momentum indicators support bearish sentiment with MACD breaking the zero line and RSI resuming a sharp downward trajectory.
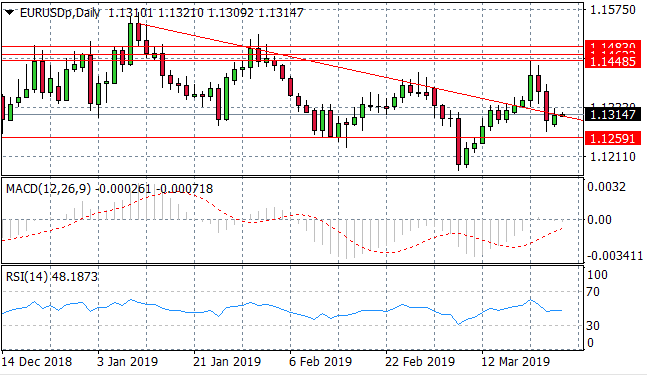
EUR/USD
The EUR/USD pair has begun to test the descending trendline once again as buyers return after the sell-off. If a break occurs, buyers may have the conviction to push prices higher, however, on previous occasions this trendline has proven a strong resistance area for the pair. Momentum indicators are mixed; with MACD on the verge of breaking the zero line and RSI in neutral territory.
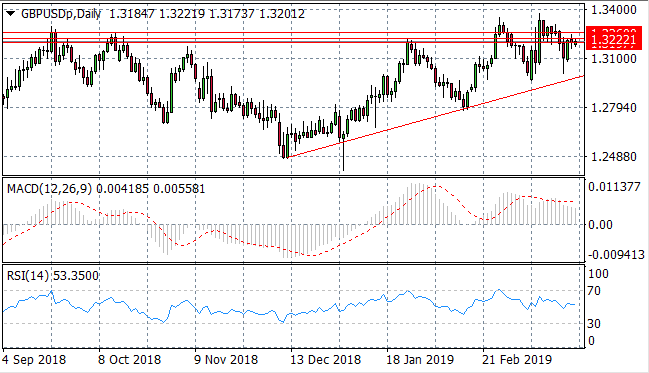
GBP/USD
The GBP/USD pair has returned to test the 1.319 price level which may only represent a pullback in the longer-term uptrend. Already buyers appear to have returned. Momentum indicators have a more bearish trajectory and are pulling back from bullish positions.

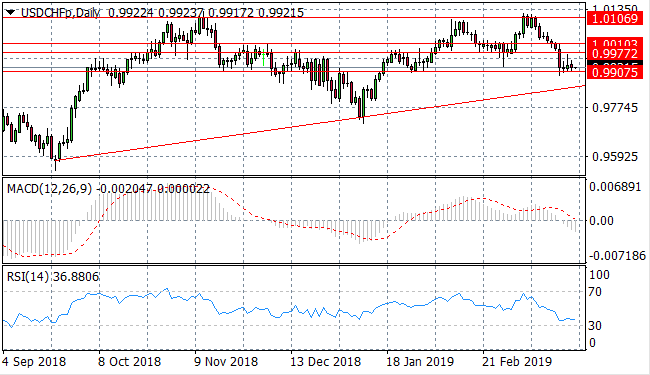
USD/CHF
The USD/CHF pair has broken a series of support levels, as the dollar suffered against the Swiss Franc. A series of doji candles have gathered around the 0.990 price level, however there are indications of selling pressure with the long upper shadows. Momentum indicators are bearish; MACD has broken the zero line and RSI is approaching the 30 oversold area.
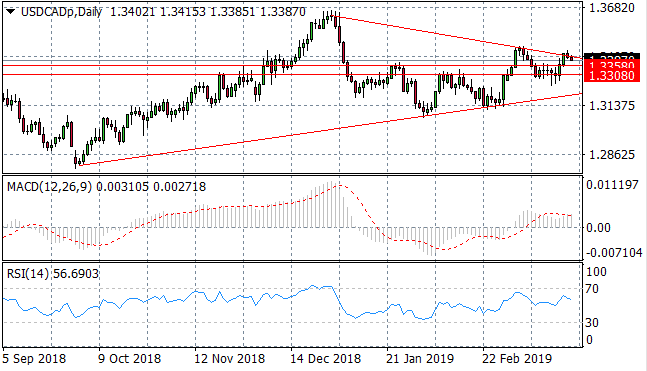
USD/CAD
The USD/CAD pair has tested and failed at the 1.335 price level with sellers returning to bring price action back below the descending trendline. Price action will likely oscillate within these two trendlines until reaching the triangle’s apex. Momentum indicators remain moderately bullish.
SILVER
Silver has finally broken the 15.42 price level and is heading towards the 15.71 resistance line. Buyers appear to be dominating the metal; momentum indicators also support the bullish sentiment with a imminent break of the zero line on MACD.

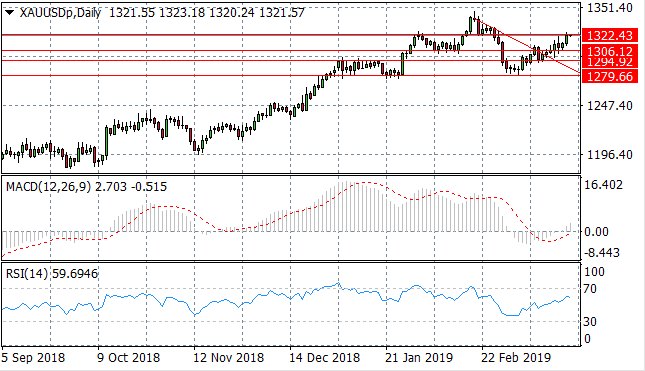
GOLD
Gold buyers appear to be dominating price action with a break of both the descending trendline and a support level at the 1306.12 price line. Now price action is testing the 1322.43 resistance line. Momentum indicators support bullish sentiment with reversals underway on both MACD and RSI.
OIL
WTI buyers dominance was short-lived with price action now pulling back to test the ascending trendline. A break would send oil back to a key resistance area around $57 per barrel. RSI has also pulled back from the overbought 70 resistance line and MACD is flat in bullish territory.

Follow Us on Facebook:
