Can The ASX200 Sustain The Rally?
- 9 Dec 2020
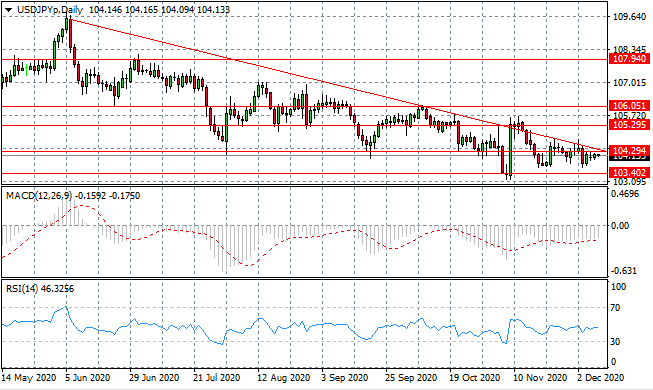
USD/JPY
USD/JPY small-bodied candles indicate that although weak, sentiment has a bullish bias. The move is only likely to go as far as the descending trendline as the longer-term bearish move continues. The pair continues to edge towards the apex of the triangle. Momentum indicators have flattened in bearish territory.
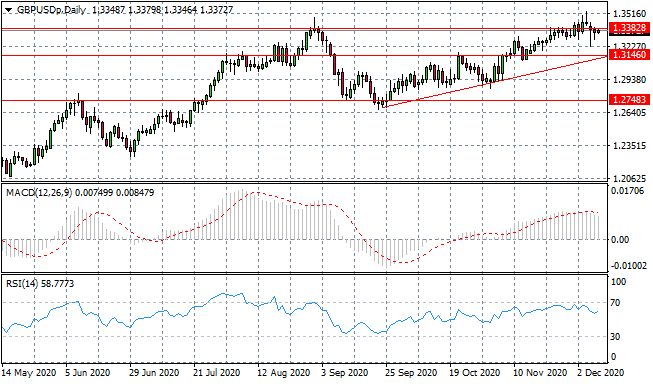
GBP/USD
The GBP/USD pair has stalled at the 1.338 price level, where buying pressure continues, yet a break has not materialised. A consolidation range between the 1.314 and 1.338 price levels may sustain the pair in the near-term. Momentum indicators are bullish with RSI pulling away from overbought conditions.
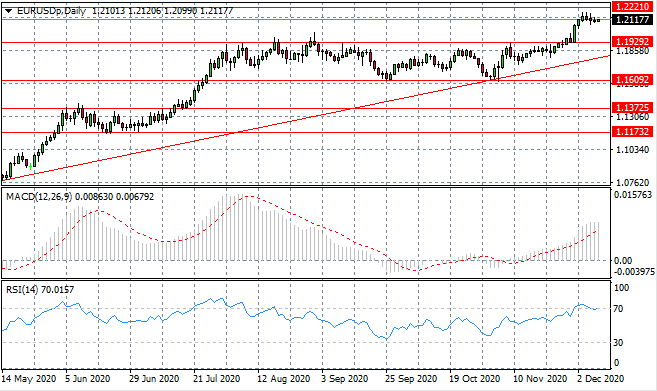
EURUSD
The Eurodollar hangs mid-range between the 1.192- 1.222 price levels. Price action will likely be subdued until fundamental factors become more apparent. A momentum indicators have flattened in bullish territory, however, RSI has turned back towards the 70 resistance line.
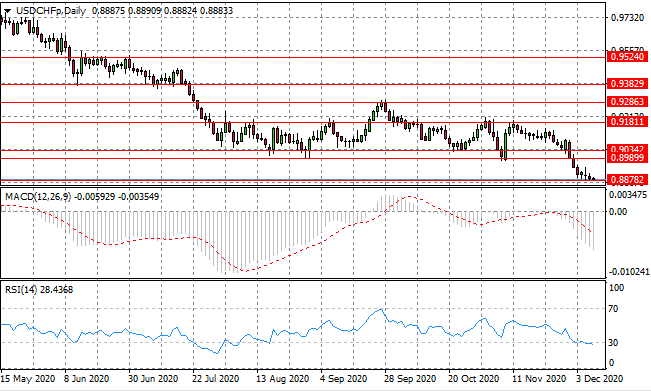
USDCHF
A price reversal appears imminent in the USDCHF pair. A series of small-bodied candles at the end of the sell-off could indicate that a reversal is imminent as sellers begin to lose steam. Any change in price direction would be significant and buyers’ conviction will need to be strong. Momentum indicators are bearish with RSI testing oversold conditions.
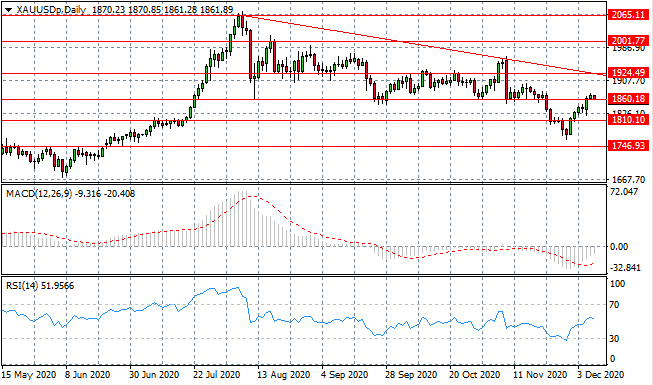
XAUUSD
XAUUSD has climbed back to the 1860.18 price level at which point, price action has stalled. The metal has re-entered into a consolidation channel where price action has oscillated for the last couple of months. Buyers’ appetite appears to be waning. Momentum indicators have sharp upward trajectories.
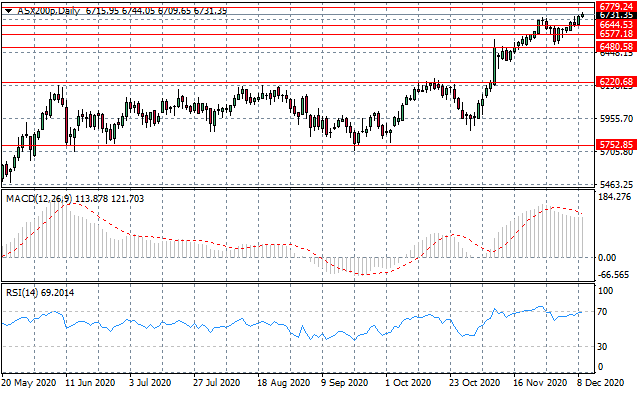
ASX200
The ASX200 continues to make steady gains and as such, is now headed back towards the 6779.24 resistance level which represents a new recent high. Despite reaching oversold conditions the index continues the rally indicating strong conviction from buyers. If price action can reach the resistance line and further, break it, the index is likely to surge higher.
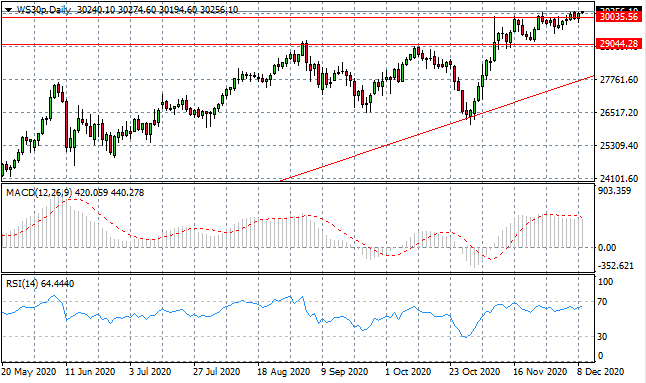
WS30
The WS30 has struggled to move passed the 30,035.56 resistance level with a tussle occurring at the top of the trading range and full break yet to be established. Overall, the longer-term trajectory for price action is bullish. Momentum indicators suggest there is further upside potential and have flattened in bullish territory.